The Survey of Establishments Say Employment is Rising, But the Survey of Households Say It Is Falling – Why?

A.  Introduction

Those who follow the monthly release of the Employment Situation report of the Bureau of Labor Statistics (with the most recent issue, for April, released on May 3) may have noticed something curious.  While the figures on total employment derived from the BLS survey of establishments reported strong growth, of an estimated 263,000 in April, the BLS survey of households (from which the rate of unemployment is estimated) reported that estimated employment fell by 103,000.  And while there is month-to-month volatility in the figures (they are survey estimates, after all), this has now been happening for several months in a row:  The establishment survey has been reporting strong growth in employment while the household survey has been reporting a fall.  The one exception was for February, where the current estimate from the establishment survey is that employment grew that month by a relatively modest 56,000 (higher than the initial estimate), while the household survey reported strong growth in employment that month of 255,000.

The chart above shows this graphically, with the figures presented in terms of their change relative to where they were in April 2017, two years ago.  For reasons we will discuss below, there is substantially greater volatility in the employment estimates derived from the household survey than one finds in the employment estimates derived from the establishment survey.  But even accounting for this, a significant gap appears to have opened up between the estimated growth in employment derived from the two sources.  Note also that the estimated labor force (derived from the household survey) has also been going down recently.  The unemployment rate came down to just 3.6% in the most recent month not because estimated employment rose – it in fact fell by 103,000 workers.  Rather, the measured unemployment rate came down because the labor force fell by even more (by 490,000 workers).

There are a number of reasons why the estimates from the two surveys differ, and this blog post will discuss what these are.  To start, and as the BLS tries to make clear, the concept of “employment” as estimated in the establishment survey is different from that as measured in the household survey.  They are measuring different, albeit close, things.  But there are other factors as well.

One can, however, work out estimates where the employment concepts are defined almost, but not quite, the same.  What is needed can be found in figures provided as part of the household survey.  We will look at those below and present the results in a chart similar to that above, but with employment figures from the household survey data adjusted (to the extent possible) to match the employment concept of the establishment survey.  But one finds that the gap that has opened up between the employment estimates of the two surveys remains, similar to that in the chart above.

There are residual differences in the two employment estimates.  And they follow a systematic pattern that appear to be correlated with the unemployment rate.  The final section below will look at this, and discuss what might be the cause.

The issues here are fairly technical ones, and this blog post may be of most interest to those interested in digging into the numbers and seeing what lies behind the headline figures that are the normal focus of news reports.  And while a consistent discrepancy appears to have opened up between the two estimates of employment growth, the underlying cause is not clear.  Nor are the implications for policy yet fully clear.  But the numbers may imply that we should be paying more attention to the much slower growth in the estimates of total employment derived from the household survey, than the figures from the establishment survey that we normally focus on.  We will find in coming months whether the inconsistency that has developed signals a change in the employment picture, or simply reflects unusual volatility in the underlying data.

B.  The BLS Surveys of Establishments, and of Households

The monthly BLS employment report is based on findings from two monthly surveys the BLS conducts, one of establishments and a second of households.  As described by the BLS in the Techincal Note that is released as part of each month’s report (and which we will draw upon here), they need both.  And while the surveys cover a good deal of material other than employment and related issues, we will focus here just on the elements relevant to the employment estimates.

The establishment survey covers primarily business establishments, but also includes government agencies, non-profits, and most other entities that employ workers for a wage.  However, the establishment survey does not include those employed in agriculture (for some reason, possibly some historical bureaucratic issue between agencies), as well as certain employment that can not be covered by a survey of establishments.  Thus they do not cover the self-employed (if they work in an unincorporated business), nor unpaid family workers.  Nor do they cover those employed directly by households (e.g. for childcare).

But for the business establishments, government agencies, and other entities that they do cover, they are thorough.  They survey more than 142,000 establishments each month, covering 689,000 individual worksites, and in all cover in this “sample” approximately one-third of all nonfarm employees.  This means they obtain direct figures each month on the employment of about 50 million workers (out of the approximately 150 million employed in the US), with this closer to a census than a normal sample survey.  But the extensive coverage is necessary in order to be able to arrive at statistically valid sample sizes at the detailed individual industries for which they provide figures.  And because of this giant sample size, the monthly employment figures cited publicly are normally taken from the establishment survey.

To arrive at unemployment rates and other figures, one must however survey households.  Businesses will know who they employ, but not who is unemployed.  And while the current sample size used of households is 60,000, this is far smaller relative to the sample size used for establishments (142,000) than it might appear.  A household will in general have just one or two workers, while a business establishment (or a government agency) could employ thousands.

Thus the much greater volatility seen in the employment estimates from the household survey should not be a surprise.  But they need the household survey to determine who is in the labor force.  They define this to be those adults of age 16 or older, who are either employed (even for just one hour, if paid) in the preceding week, or who, if not employed, were available for a job and were actively searching for one at some point in the four week period before the week of the survey.  Only in this way can the BLS determine the share of the labor force that is employed, and the share unemployed.  The survey of establishments by its nature cannot provide such information no matter what its sample size.

For this and other reasons, the definition of what is covered in “employment” between these two surveys will differ.  In particular:

a)  As discussed above, the establishment survey does not cover employment in the agricultural sector.  While they could, in principle, include agriculture, for some reason they do not.  The household survey does include those in agriculture.

b)  The establishment survey also does not include the self-employed (unless they are running an incorporated business).  They only survey businesses (or government agencies and non-profits), and hence cannot capture those who are self-employed.

c)  The establishment survey also does not capture unpaid family workers.  The household survey counts them as part of the labor force and employed if they worked in the family business 15 hours or more in the week preceding the survey.

d)  The establishment survey, since it does not cover households, cannot include private household workers (such as those providing childcare services).  The household survey does.

e)  Each of the above will lead to the count in the household survey of those employed being higher than what is counted in the establishment survey.  Working in the opposite direction, someone holding two or more jobs will be counted in the establishment survey two or more times (once for each job they hold).  The establishment being surveyed will only know who is working for them, and not whether they are also working elsewhere.  The household survey, however, will count such a worker as just one employed person.

f) The household survey also counts as employed those who are on unpaid leave (such as maternity leave).  The establishment survey does not (although it is not clear to me why they couldn’t – it would improve comparability if they would).

g)  The household survey also only includes those aged 16 or older as possibly in the labor force and employed.  The establishment survey covers all its workers, whatever their age.

There are therefore important differences between the two surveys as to who is covered in the figures provided for “total employment”.  And while the BLS tries to make this clear, the differences are often ignored in references by, for example, the news media.  One can, however, adjust for most, but not all, of these differences.  The data required are provided in the BLS monthly report (for recent months), or online (for the complete series).  But how to do so is not made obvious, as the data series required are scattered across several different tables in the report.

I will discuss in more detail in the next section below what I did to adjust the household survey figures to the employment concept as used in the establishment survey.  Adjustments could be made for each of the categories (a) through (e) in the list above, but was not possible for (f) and (g).  However, the latter are relatively small, with the residual difference following an interesting pattern that we will examine.

When those adjustments are made, the number of employed as estimated from the household survey, but reflecting (almost) the concept as estimated in the establishment survey, looks as follows:


While there are some differences between the estimates here and those in the chart at the top of this post of employment made using the household survey (as adjusted), the basic pattern remains.  While employment as estimated from the household survey (and excluding those in agriculture, the self-employed, unpaid family workers, household employees, and adjusted for multiple jobholders) is now growing, it was growing over the last half year at a much slower pace than what the establishment survey suggests.

C.  Adjustments Made to the Employment Estimates So They Will Reflect Similar Concepts

As noted above, adjustments were made to the employment figures to bring the two concepts of the different surveys into line with each other, to the extent possible.  While in principle one could have adjusted either, I chose to adjust the employment concept of the household survey to reflect the more narrow employment concept of the establishment survey.  This was because the underlying data needed to make the adjustments all came from the household survey, and it was better to keep the figures for the adjustments to be made all from the same source.

Adjustments could be made to reflect each of the issues listed above in (a) through (e), but not for (f) or (g).  But there were still some issues among the (a) through (e) adjustments.  Specifically:

1)  I sought to work out the series going back to January 1980, in order to capture several business cycles, but not all of the data required went back that far.  Specifically, the series on those holding multiple jobs started only in January 1994, and the series on household employees only started in January 2000.

2)  I also worked, to the extent possible, with the seasonally adjusted figures (for the establishment survey figures as well as those from the household survey).  However, the figures on unpaid family workers and of household employees were only available without seasonal adjustment.  I was therefore forced to use these.  But since the numbers in these categories are quite small relative to the overall number employed, one does not see a noticeable difference in the graphs.

One can then compare, as a ratio, the figures for total employment as adjusted from the household survey to those from the establishment survey.  The ratio will equal 1.0 when the figures are the same.  This was done in steps (depending on how far back one could go with the data), with the result:


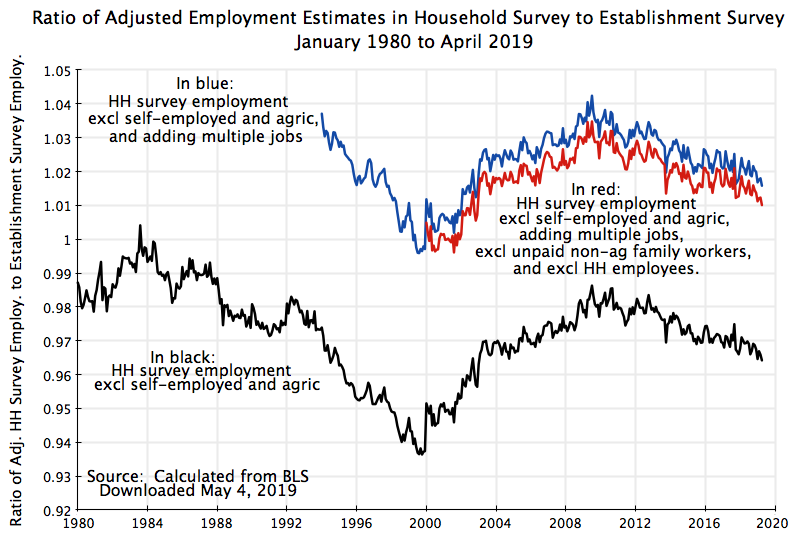
The curve in black, which can go back all the way to 1980, shows the ratio when the employment figure in the household survey is adjusted by taking out those who are self-employed (in unincorporated businesses) and those employed in agriculture.  The curve in blue, from 1994 onwards, then adds in one job for each of those holding multiple jobs.  The assumption being made is that those with multiple jobs almost always have two jobs.  The establishment survey would count these as two employees (at two different establishments), while the household survey will only count these as one person (holding more than one job).  Therefore adding a count of one for each person holding multiple jobs will bring the employment concepts used in the two surveys into alignment (and on the basis used in the establishment survey).

Finally, the curve in red subtracts out unpaid family workers in non-agricultural sectors (as those in the agricultural sector will have already been taken out when total employees in agriculture were subtracted), plus subtracts out household employees.  Neither of these series are available in seasonally adjusted form, but they are small relative to total employment, so this makes little difference.

What is interesting is that even with all these adjustments, the ratio of the adjusted figures for employment from the household survey to those from the establishment survey follows a regular pattern.  The ratio is low when unemployment was low (as it was in 2000, at the end of the Clinton administration, and to a lesser extent now).  And it is high when unemployment was high, such as in mid-1980s during the Reagan administration (with a downturn that started in 1982) and again during the downturn of 2008/09 that began at the end of the Bush administration, with unemployment then peaking in 2010 before it started its steady recovery.

Keep in mind that the relative difference in the employment figures between the household survey (as adjusted) and the establishment survey are not large:  about 1% now and a peak of about 3% in 2009/10.  But there is a consistent difference.

Why?  In part there are still two categories of workers where we had no estimates available to adjust the figures from the household survey to align them with the employment concept of the establishment survey:  for those on unpaid leave (who are included as “employed” in the household survey but not in the establishment survey), and for those under age 16 who are working (who are not counted in the household survey but are counted as employees in the establishment survey).

These two categories of workers might account for the difference, but we do not know whether they will fully account for the difference as we have no estimates.  A more interesting question is whether these two categories might account for the correlation observed with unemployment.  We could speculate that during periods of high unemployment (such as 2009/10), those taking unpaid leave might be relatively high (thus bumping up the ratio), and that those under age 16 may find it particularly hard, relative to others, to find jobs when unemployment is high (as employers can easily higher older workers then, with this then also bumping up the ratio relative to times when overall unemployment is low).  But this would just be speculation, and indeed more like an ex-post rationalization of what is observed than an explanation.

Still, despite the statistical noise seen in the chart, the basic pattern is clear.  And that is of a ratio that goes up and down with unemployment.  But it is not large.  Based on the change in the ratio observed from May 2010 to April 2011 (using a 12 month average to smooth out the monthly fluctuations), to the average over May 2018 to April 2019, the monthly divergence in the employment growth figures would only be 23,000 workers.  That is, the unexplained residual difference in recent years between the growth in employment (as estimated by the household survey and as estimated by the establishment survey) would be about 23,000 jobs per month.

But the differences in the estimates for the monthly change in employment between the (adjusted) series from the household survey and that from the establishment survey are much more.  Between October 2018 and April 2019, employment in the adjusted household survey series grew by 65,000 per month on average.  In the establishment survey series the growth was 207,000 per month.  The difference (142,000) is much greater than the 23,000 that can be explained by whatever has been driving down the ratio between the two series since 2010 as unemployment has come down.  Or put another way, the 65,000 figure can be increased by 23,000 per month to 88,000 per month, from adding in the unexplained residual change we observe in the ratio between the two series in recent years.  That 88,000 increase in employment per month from the (adjusted) household survey figures is substantially less than the 207,000 per month figure found in the establishment survey.

D.  Conclusion

Due to the statistical noise in the employment estimates of the household series, one has to be extremely cautious in drawing any conclusions.  While a gap has opened up in the last half year between the growth in the employment estimates of the household survey and those of the establishment survey, it is still early to say whether that gap reflects something significant or not.

The gap is especially large if one just looks at the “employment” figures as published.  Employment as recorded in the household survey has fallen between December 2018 and now, and has been essentially flat since October.  But the total employment concepts between the two surveys differ, so such a direct comparison is not terribly meaningful.  However, if the figures from the household survey are adjusted (to the extent possible) to match the employment concept of the business survey, there is still a large difference.  Employment (under this concept) grew by 207,000 per month in the establishment survey, but by just 88,000 per month in the adjusted household survey figures.

Whether this difference is significant is not yet clear, due to the statistical noise in the household survey figures.  But it might be a sign that employment growth has been less than the headline figures from the establishment survey suggest.  We will see in coming months whether this pattern continues, or whether one series starts tracking the other more closely (and if so, which to which).

Allow the IRS to Fill In Our Tax Forms For Us – It Can and It Should

A.  Introduction

Having recently completed and filed this year’s income tax forms, it is timely to examine what impact the Republican tax bill, pushed quickly through Congress in December 2017 along largely party-line votes, has had on the taxes we pay and on the process by which we figure out what they are.  I will refer to the bill as the Trump/GOP tax bill as the new law reflected both what the Republican leadership in Congress wanted and what the Trump administration pushed for.

We already know well that the cuts went largely to the very well-off.  The chart above is one more confirmation of this.  It was calculated from figures in a recent report by the staff of the Joint Committee on Taxation of the US Congress, released on March 25, 2019 (report #JCX-10-19).  While those earning more than $1 million in 2019 will, on average, see their taxes cut by $64,428 per tax filing unit (i.e. generally households), those earning $10,000 or less will see a reduction of just $21.  And on the scale of the chart, it is indeed difficult to impossible even to see the bars depicting the reductions in taxes for those earning less than $50,000 or so.

The sharp bias in favor of the rich was discussed in a previous post on this blog, based there on estimates from a different group (the Tax Policy Center, a non-partisan think tank) but with similar results.  And while it is of course true that those who are richer will have more in taxes that can be cut (one could hardly cut $64,428 from a taxpayer earning less than $10,000), it is not simply the absolute amounts but also the share of taxes which were cut much further for the rich than for the poor.  According to the Joint Committee on Taxation report cited above, those earning $30,000 or less will only see their taxes cut by 0.5% of their incomes, while those earning between $0.5 million and $1.0 million will see a cut of 3.1%.  That is more than six times as much as a share of incomes.  That is perverse.

And the overall average reduction in individual income taxes will only be a bit less than 10% of the tax revenues being paid before.  This is in stark contrast to the more than 50% reduction in corporate income taxes that we have already observed in what was paid by corporations in 2018.

Furthermore, while taxes for households in some income category may have on average gone down, the numerous changes made to the tax code on the Trump/GOP bill meant that for many it did not.  Estimates provided in the Joint Committee on Taxation report cited above (see Table 2 of the report) indicate that for 2019 a bit less than two-thirds of tax filing units (households) will see a reduction in their taxes of $100 or more, but more than one-third will see either no significant change (less than $100) or a tax increase.  The impacts vary widely, even for those with the same income, depending on a household’s particular situation.

But the Trump/GOP tax bill promised not just a reduction in taxes, but also a reduction in tax complexity, by eliminating loopholes and from other such measures.  The claim was that most Americans would then be able to fill in their tax returns “on a postcard”.  But as is obvious to anyone who has filed their forms this year, it is hardly that.  This blog post will discuss why this is so and why filling in one’s tax returns remains such a headache.  The fundamental reason is simple:  The tax system is not less complex than before, but more.

There is, however, a way to address this, and not solely by ending the complexity (although that would in itself be desirable).  Even with the tax code as complicated as it now is (and more so after the Trump/GOP bill), the IRS could complete for each of us a draft of what our filing would look like based on the information that the IRS already collects.  Those draft forms would match what would be due for perhaps 80 to 85% of us (basically almost all of those who take the standard deduction).  For that 80 to 85% one would simply sign the forms and return them along with a payment if taxes are due or a request for a refund if a refund is due.  Most remaining taxpayers would also be able to use these initial draft forms from the IRS, but for them as the base for what they would need to file.  In their cases, additions or subtractions would be made to reflect items such as itemized deductions (mostly) and certain special tax factors (for some) where the information necessary to complete such calculations would not have been provided in the normal flow of reports to the IRS.  And a small number of filers might continue to fill in all their forms as now.  That small number would be no worse than now, while life would be much simpler for the 95% or more (perhaps 99% or more) who could use the pre-filled in forms from the IRS either in their entirety or as a base to start from.

The IRS receives most of the information required to do this already for each of us (and all that is required for most of us).  But what would be different is that instead of the IRS using such information to check what we filed after the fact, and then impose a fine (or worse) if we made a mistake, the IRS would now use that same information to fill in the forms for us.  We would then review and check them, and if necessary or advantageous to our situation we could then adjust them.  We will discuss how such a tax filing system could work below.

B.  Our Tax Forms are Now Even More Complex Than Before

Trump and the Republican leaders in Congress promised that with the Trump/GOP tax bill, the tax forms we would need to file could, for most of us, fit just on a postcard.  And Treasury Secretary Steven Mnuchin then asserted that the IRS (part of Treasury) did just that.  But this is simply nonsense, as anyone who has had to struggle with the new Form 1040s (or even just looked at them) could clearly see.

Specifically:

a)  Form 1040 is not a postcard, but a sheet of paper (front and back), to which one must attach up to six separate schedules.  This previously all fit on one sheet of paper, but now one has to complete and file up to seven just for the 1040 itself.

b)  Furthermore, there are no longer the forms 1040-EZ or 1040-A which were used by those with less complex tax situations.  Now everyone needs to work from a fully comprehensive Form 1040, and try to figure out what may or may not apply in their particular circumstances.

c)  The number of labeled lines on the old 1040 came to 79.  On the new forms (including the attached schedules) they come to 75.  But this is misleading, as what used to be counted as lines 1 through 6 on the old 1040 are now no longer counted (even though they are still there and are needed).  Including these, the total number of numbered lines comes to 81, or basically the same as before (and indeed more).

d)  Spreading out the old Form 1040 from one sheet of paper to seven does, however, lead to a good deal of extra white space.  This was likely done to give it (the first sheet) the “appearance” of a postcard.  But the forms would have been much easier to fill in, with less likelihood of error, if some of that white space had been used instead for sub-totals and other such entries so that all the steps needed to calculate one’s taxes were clear.

e)  Specifically, with the six new schedules, one has to carry over computations or totals from five of them (all but the last) to various lines on the 1040 itself.  But this was done, confusingly, in several different ways:  1)  The total from Schedule 4 was carried over to its own line (line 14) on the 1040.  It would have been best if all of them had been done this way, but they weren’t.  Instead, 2) The total from Schedule 2 was added to a number of other items on line 11 of the 1040, with the total of those separate items then shown on line 11.  And 3) The total from Schedule 1 was added to the sum of what is shown on the lines above it (lines1 through 5b of the 1040) and then recorded on line 6 of the 1040.

If this looks confusing, it is because it is.  I made numerous mistakes on this when completing my own returns (yes – I do these myself, as I really want to know how they are done).  I hope my final returns were done correctly.  And it is not simply me.  Early indications (as of early March) were that errors on this year’s tax forms were up by 200% over last year’s (i.e. they tripled).

f)  There is also the long-standing issue that the actual forms that one has to fill out are in fact substantially greater than those that one files, as one has to fill in numerous worksheets in order to calculate certain of the figures.  These worksheets should be considered part of the returns, and not hidden in the directions, in order to provide an honest picture of what is involved.  And they don’t fit on a postcard.

g)  But possibly what is most misleading about what is involved in filling out the returns is not simply what is on the 1040 itself, but also the need to include on the 1040 figures from numerous additional forms (for those that may apply).  Few if any of them are applicable to one’s particular tax situation, but to know whether they do or not one has to review each of those forms and make such a determination.  How does one know whether some form applies when there is a statement on the 1040 such as “Enter the amount, if any, from Form xxxx”?  The only way to know is to look up the form (fortunately now this can be done on the internet), read through it along with the directions, and then determine whether it may apply to you.  Furthermore, in at least a few cases one can only know if the form applies to your situation is by filling it in and then comparing the result found to some other item to see whether filing that particular form applies to you.

There are more than a few such forms.  By my count, one has just on the Form 1040 plus its Schedules 1 through 5 amounts that might need to be entered from Forms 8814, 4972, 8812, 8863, 4797, 8889, 2106, 3903, SE, 6251, 8962, 2441, 8863, 8880, 5695, 3800, 8801,1116, 4137, 8919, 5329, 5405, 8959, 8960, 965-A, 8962, 4136, 2439, and 8885.  Each of these forms may apply to certain taxpayers, but mostly only a tiny fraction of them.  But all taxpayers will need to know whether they might apply to their particular situation.  They can often guess that they probably won’t (and it likely would be a good guess, as most of these forms only apply to a tiny sliver of Americans), but the only way to know for sure is to check each one out.

Filling out one’s individual income tax forms has, sadly, never been easy.  But it has now become worse.  And while the new look of the Form 1040 appears to be a result of a political decision by the Trump administration (“make it look like it could fit on a postcard”), the IRS should mostly not be blamed for the complexity.  That complexity is a consequence of tax law, as written by Congress, which finds it politically advantageous to reward what might be a tiny number of supporters (and campaign contributors) with some special tax break.  And when Congress does this, the IRS must then design a new form to reflect that new law, and incorporate it into the Form 1040 and now the new attached schedules.  And then everyone, not simply the tiny number of tax filers to whom it might in fact apply, must then determine whether or not it applies to them.

There are, of course, also more fundamental causes of the complexity in the tax code, which must then be reflected in the forms.  The most important is the decision by our Congress to tax different forms of income differently, where wages earned will in general be taxed at the highest rates (up to 37%) while capital gains (including dividends on stocks held for more than 60 days) are taxed at rates of just 20% or less.  And there are a number of other forms of income that are taxed at various rates (including now, under the Trump/GOP tax bill, an effectively lower tax rate for certain company owners on the incomes they receive from their companies, as well as new special provisions of benefit to real estate developers).  As discussed in an earlier post on this blog, there is no good rationale, economic or moral, to justify this.  It leads to complex tax calculations as the different forms of income must each be identified and then taxed at rates that interact with each other.  And it leads to tremendous incentives to try to shift your type of income, when you are in a position to do so, from wages, say, to a type taxed at a lower rate (such as stock options that will later be taxed only at the long-term capital gains rate).

Given this complexity, it is no surprise that most Americans turn either to professional tax preparers (accountants and others) to fill in their tax forms for them, or to special tax preparation software such as TurboTax.  Based on statistics for the 2018 tax filing season (for 2017 taxes), 72.1 million tax filers hired professionals to prepare their tax forms, or 51% of the 141.5 million tax returns filed.  The cost varies by what needs to be filed, but even assuming an average fee of just $500 per return, this implies a total of over $36 billion is being paid by taxpayers for just this service.

Most of the remaining 49% of tax filers use tax preparation software for their returns (a bit over three-quarters of them).  But these are problematic as well.  There is also a cost (other than for extremely simple returns), but the software itself may not be that good.  A recent review by Consumer Reports found problems with each of the four major tax preparation software packages it tested (TurboTax, H&R Block, TaxSlayer, and TaxAct), and concluded they are not to be trusted.

And on top of this, there is the time the taxpayer must spend to organize all the records that will be needed in order to complete the tax returns – whether by a hired professional tax preparer, or by software, or by one’s own hand.  A 2010 report by a presidential commission examing options for tax reform estimated that Americans spend about 2.5 billion hours a year to do what is necessary to file their individual income tax returns, equivalent to $62.5 billion at an average time cost of $25 per hour.

Finally there are the headaches.  Figuring one’s taxes, even if a professional is hired to fill in the forms, is not something anyone wants to spend time on.

There is a better way.  With the information that is already provided to the IRS each year, the IRS could complete and provide to each of us a draft set of tax forms which would suffice (i.e. reflect exactly what our tax obligation is) for probably 80% or more of households.  And most of the remainder could use such draft forms as a base and then provide some simple additions or subtractions to arrive at what their tax obligation is.  The next section will discuss how this could be done.

C.  Have the IRS Prepare Draft Tax Returns for Each of Us

The IRS already receives, from employers, financial institutions, and others, information on the incomes provided to each of us during the tax year.  And these institutions then tell us each January what they provided to the IRS.  Employers tell us on W-2 forms what wages were paid to us, and financial institutions will tell us through various 1099 forms what was paid to us in interest, in dividends, in realized capital gains, in earnings from retirement plans, and from other such sources of returns on our investments.  Reports are also filed with the IRS for major transactions such as from the sale of a home or other real estate.

The IRS thus has very good information on our income each year.  Our family situation is also generally stable from year to year, although it can vary sometimes (such as when a child is born).  But basing an initial draft estimate on the household situation of the previous year will generally be correct, and can be amended when needed.  One could also easily set up an online system through which tax filers could notify the IRS when such events occur, to allow the IRS to incorporate those changes into the draft tax forms they next produce.

For most of those who take the standard deduction, the IRS could then fill in our tax forms exactly.  And most Americans take the standard deduction. Prior to the Trump/GOP tax bill, about 70% of tax filers did, and it is now estimated that with the changes resulting from the new tax bill, about 90% will.  Under the Trump/GOP tax bill, the basic standard deduction was doubled (while personal exemptions were eliminated, so not all those taking the standard deduction ended up better off).  And perhaps of equal importance, the deduction that could be taken on state and local taxes was capped at $10,000 while how much could be deducted on mortgage interest was also narrowed, so itemization was no longer advantageous for many (with these new limitations primarily affecting those living in states that vote for Democrats – not likely a coincidence).

The IRS could thus prepare filled in tax forms for each of us, based on information contained in what we had filed in earlier years and assuming the standard deduction is going to be taken.  But they would just be drafts.  They would be sent to us for our review, and if everything is fine (and for most of the 90% taking the standard deduction they would be) we would simply sign the forms and return them (along with a check if some additional tax is due, or information on where to deposit a refund if a tax refund is due).

But for the 10% where itemized deductions are advantageous, and for a few others who are in some special tax situation, one could either start with the draft forms and make additions or subtractions to reflect simple adjustments, or, if one wished, prepare a new set of forms reflecting one’s tax situation.  There would likely not be many of the latter, but it would be an option, and no worse than what is currently required of everyone.

For those making adjustments, the changes could simply be made at the end.  For example (and likely the most common such situation), suppose it was advantageous to take itemized deductions rather than the standard deduction.  One would fill in the regular Schedule A (as now), but then rather than recomputing all of the forms, one could subtract from the taxes due an amount based on what the excess was of the itemized deductions over the standard deduction, and one’s tax rate.  Suppose the excess of the itemized deductions over the standard deduction for the filer came to $1,000.  Then for the very rich (households earning over $600,000 a year after deductions), one would reduce the taxes due by 37%, or $370.  Those earning $400,000 to $600,000, in the 35% bracket, would subtract $350.  And so on down to the lower brackets, where those in the 12% bracket (those earning $19,050 to $77,400) would subtract $120 (and those earning less than $19,050 are unlikely to itemize).

[Side Note:  Why do the rich receive what is in effect a larger subsidy from the government than the poor do for what they itemize, such as for contributions to charities?  That is, why do the rich effectively pay just $630 for their contribution to a charity ($1,000 minus $370), while the poor pay $880 ($1,000 minus $120) for their contribution to possibly the exact same charity?  There really is no economic, much less moral, reason for this, but that is in fact how the US tax code is currently written.  As discussed in an earlier post on this blog, the government subsidy for such deductions could instead be set to be the same for all, at say a rate of 20% or so.  There is no reason why the rich should receive a bigger subsidy than the poor receive for the contributions they make.]

Another area where the information the IRS would not have complete information to compute taxes due would be where the tax filer had sold a capital asset which had been purchased before 2010.  The IRS only started in 2010 to require that financial institutions report the cost basis for assets sold, and this cost basis is needed to compute capital gains (or losses).  But as time passes, a smaller and smaller share of assets sold will have been purchased before 2010.  The most important, for most people, will likely be the cost of the home they bought if before 2010, but such a sale will happen only once (unless they owned multiple real estate assets in 2010).

But a simple adjustment could be made to reflect the cost basis of such assets, similar to the adjustment for itemized deductions.  The draft tax forms filled in by the IRS would leave as blank (zero) the cost basis of the assets sold in the year for which it did not have a figure reported.  The tax filer would then determine what the cost basis of all such assets should be (as they do now), add them up, and then subtract 20% of that total cost basis from the taxes due (for those in the 20% bracket for long term capital gains, as most people with capital gains are, or use 15% or 0% if those tax brackets apply in their particular cases).

There will still be a few tax filers with more complex situations where the IRS draft computations are not helpful, who will want to do their own forms.  This is fine – there would always be that option.  But such individuals would still be no worse off than what is required now.  And their number is likely to be very small.  While a guess, I would say that what the IRS could provide to tax filers would be fully sufficient and accurate for 80 to 85% of Americans, and that simple additions or subtractions to the draft forms (as described above) would work for most of the rest.  Probably less than 5% of filers would need to complete a full set of forms themselves, and possibly less than 1%.

D. Final Remarks

Such an approach would be new for the US.  But there is nothing revolutionary about it.  Indeed, it is common elsewhere in the world.  Much of Western Europe already follows such an approach or some variant of it, in particular all of the Scandinavian countries as well as Germany, Spain, and the UK, and also Japan.  Small countries, such as Chile and Estonia, have it, as do large ones.

It has also often been proposed for the US.  Indeed, President Reagan proposed it as part of his tax reduction and simplification bill in 1985, then candidate Barack Obama proposed it in 2007 in a speech on middle class tax fairness, a presidential commission in 2010 included it as one of the proposals in its report on simplifying the tax system, and numerous academics and others have also argued in its favor.

It would also likely save money at the IRS.  The IRS collects already most of the information needed.  But that information is not then sent back to us in fully or partially filled in tax forms, but rather is used by the IRS after we file to check to see whether we got anything wrong.  And if we did, we then face a fine or possibly worse.  Completing our tax returns should not be a game of “gotcha” with the IRS, but rather an effort to ensure we have them right.

Such a reform has, however, been staunchly opposed by narrow interests who benefit from the current frustrating system.  Intuit, the seller of TurboTax software, has been particularly aggressive through its congressional lobbying and campaign contributions in using Congress to block the IRS from pursuing this, as has H&R Block.  They of course realize that if tax filing were easy, with the IRS completing most or all of the forms for us, there would be no need to spend what comes to billions of dollars for software from Intuit and others.  But the morality of a business using its lobbying and campaign contributions to ensure life is made particularly burdensome for the citizenry, so that it can then sell a product to make it easier, is something to be questioned.

One can, however, understand the narrow commercial interests of Intuit and the tax software companies.  One can also, sadly, understand the opposition of a number of conservative political activists, with Grover Norquist the most prominent and in the lead. They have also aggressively lobbied Congress to block the IRS from making tax filing simpler.  They are ideologically opposed to taxes, and see the burden and difficulty in figuring out one’s taxes as a positive, not as a negative.  The hope is that with more people complaining about how difficult it is to fill in their tax forms, the more people will be in favor of cutting taxes.  While that view on how people see taxes might well be accurate, what many may not realize is that the tax cuts of recent decades have led to greater complexity and difficulty, not less.  With new loopholes for certain narrow interests, and with income taxed differently depending on the source of that income (with income from wealth taxed at a much lower rate than income from labor), the system has become more complex while generating less revenue overall.

But it is perverse that Congress should legislate in favor of making life more difficult.  The tax system is indeed necessary and crucial, as Reagan correctly noted in his 1985 speech on tax reform, but as he also noted in that speech, there is no need to make them difficult.  Most Americans, Reagan argued, should be able, and would be able under his proposals, to use what he called a “return-free” system, with the IRS working out the taxes due.

The system as proposed above would do this.  It would also be voluntary.  If one disagreed with the pre-filled in forms sent by the IRS, and could not make the simple adjustments (up or down) to the taxes due through the measures as discussed above, one could always fill in the entire set of forms oneself.  But for that small number of such cases this would just be the same as is now required for all.  Furthermore, if one really was concerned about the IRS filling in one’s forms for some reason (it is not clear what that might be), one could easily have a system of opting-out, where one would notify the IRS that one did not want the service.

The tax code itself should still be simplified.  There are many reforms that can and should be implemented, if there was the political will.  The 2010 presidential commission presented numerous options for what could be done.  But even with the current complex system, or rather especially because of the current complex system, there is no valid reason why figuring out and filing our taxes should be so difficult.  Let the IRS do it for us.

Taxes on Corporate Profits Have Continued to Collapse


The Bureau of Economic Analysis (BEA) released earlier today its second estimate of GDP growth in the fourth quarter ot 2018.  (Confusingly, it was officially called the “third” estimate, but was only the second as what would have been the first, due in January, was never done due to Trump shutting down most agencies of the federal government in December and January due to his border wall dispute.)  Most public attention was rightly focussed on the downward revision in the estimate of real GDP growth in the fourth quarter, from a 2.6% annual rate estimated last month, to 2.2% now.  And current estimates are that growth in the first quarter of 2019 will be substantially less than that.

But there is much more in the BEA figures than just GDP growth.  The second report of the BEA also includes initial estimates of corporate profits and the taxes they pay (as well as much else).  The purpose of this note is to update an earlier post on this blog that examined what happened to corporate profit tax revenues following the Trump / GOP tax cuts of late 2017.  That earlier post was based on figures for just the first half of 2018.

We now have figures for the full year, and they confirm what had earlier been found – corporate profit tax revenues have indeed plummeted.  As seen in the chart at the top of this post, corporate profit taxes were in the range of only $150 to $160 billion (at annual rates) in the four quarters of 2018.  This was less than half the $300 to $350 billion range in the years before 2018.  And there is no sign that this collapse in revenues was due to special circumstances of one quarter or another.  We see it in all four quarters.

The collapse shows through even more clearly when one examines what they were as a share of corporate profits:


The rate fell from a range of generally 15 to 16%, and sometimes 17%, in the earlier years, to just 7.0% in 2018.  And it was an unusually steady rate of 7.0% throughout the year.  Note that under the Trump / GOP tax bill, the standard rate for corporate profit tax was cut from 35% previously to a new headline rate of 21%.  But the actual rate paid turned out (on average over all firms) to come to just 7.0%, or only one-third as much.  The tax bill proponents claimed that while the headline rate was being cut, they would close loopholes so the amount collected would not go down.  But instead loopholes were not only kept, but expanded, and revenues collected fell by more than half.

If the average corporate profit tax rate paid in 2018 had been not 7.0%, but rather at the rate it was on average over the three prior fiscal years (FY2015 to 2017) of 15.5%, an extra $192.2 billion in revenues would have been collected.

There was also a reduction in personal income taxes collected.  While the proportional fall was less, a much higher share of federal income taxes are now borne by individuals than by corporations.  (They were more evenly balanced decades ago, when the corporate profit tax rates were much higher – they reached over 50% in terms of the amount actually collected in the early 1950s.)  Federal personal income tax as a share of personal income was 9.2% in 2018, and again quite steady at that rate over each of the four quarters.  Over the three prior fiscal years of FY2015 to 2017, this rate averaged 9.6%.  Had it remained at that 9.6%, an extra $77.3 billion would have been collected in 2018.

The total reduction in tax revenues from these two sources in 2018 was therefore $270 billion.  While it is admittedly simplistic to extrapolate this out over ten years, if one nevertheless does (assuming, conservatively, real growth of 1% a year and price growth of 2%, for a total growth of about 3% a year), the total revenue loss would sum to $3.1 trillion.  And if one adds to this, as one should, the extra interest expense on what would now be a higher public debt (and assuming an average interest rate for government borrowing of 2.6%), the total loss grows to $3.5 trillion.

This is huge.  To give a sense of the magnitude, an earlier post on this blog found that revenues equal to the original forecast loss under the Trump / GOP tax plan (summing to $1.5 trillion over the next decade, and then continuing) would suffice to ensure the Social Security Trust Fund would be fully funded forever.  As things are now, if nothing is done the Trust Fund will run out in about 2034.  And Republicans insist that the gap is so large that nothing can be done, and that the system will have to crash unless retired seniors accept a sharp reduction in what are already low benefits.

But with losses under the Trump / GOP tax bill of $3.1 trillion over ten years, less than half of those losses would suffice to ensure Social Security could survive at contracted benefit levels.  One cannot argue that we can afford such a huge tax cut, but cannot afford what is needed to ensure Social Security remains solvent.

In the nearer term, the tax cuts have led to a large growth in the fiscal deficit.  Even the US Treasury itself is currently forecasting that the federal budget deficit will reach $1.1 trillion in FY2019 (5.2% of GDP), up from $779 billion in FY2018.  It is unprecedented to have such high fiscal deficits at a time of full employment, other than during World War II.  Proper fiscal management would call for something closer to a balanced budget, or even a surplus, in those periods when the economy is at full employment, while deficits should be expected (and indeed called for) during times of economic downturns, when unemployment is high.  But instead we are doing the opposite.  This will put the economy in a precarious position when the next economic downturn comes.  And eventually it will, as it always has.