Social Security Could be Saved With the Revenues Lost Under the Trump Tax Plan

As is well known, the Social Security Trust Fund will run out in about 2034 (plus or minus a year) if nothing is done.  “Running out” means that the past accumulated stock of funds paid in through Social Security taxes on wages, plus what is paid in each year, will not suffice to cover what is due to be paid out that year to beneficiaries.  If nothing is done, Social Security payments would then be scaled back by 23% (in 2034, rising to 27% by 2091), to match the amount then being paid in each year.

This would be a disaster.  Social Security does not pay out all that much:  An average of just $15,637 annually per beneficiary for those in retirement and their survivors, and an average of just $12,452 per beneficiary for those on disability (all as of August 2017).  But despite such limited amounts, Social Security accounts for almost two-thirds (63%) of the incomes of beneficiaries age 65 or older, and 90% or more of the incomes of fully one-third of them.  Scaling back such already low payments, when so many Americans depend so much on the program, should be unthinkable.

Yet Congress has been unwilling to act, even though the upcoming crisis (if nothing is done) has been forecast for some time.  Furthermore, the longer we wait, the more severe the measures that will then be necessary to fix the problem.  It should be noted that the crisis is not on account of an aging population (one has pretty much known for 64 years how many Americans would be reaching age 65 now), nor because of a surprising jump in life expectancies (indeed, life expectancies have turned out to be lower than what had been forecast).  Rather, as discussed in an earlier post on this blog, the crisis has arisen primarily because wage income inequality has grown sharply (and unexpectedly) since around 1980, and this has pulled an increasing share of wages into the untaxed range above the ceiling for annual earnings subject to Social Security tax ($127,200 currently).

But Congress could act, and there are many different approaches that could be taken to ensure the Social Security Trust Fund remains adequately funded.  This post will discuss just one.  And that would be not to approve the Trump proposal for what he accurately calls would be a huge cut in taxes, and use the revenues that would be lost under his tax plan instead to shore up the Social Security Trust Fund.  As the chart at the top of this post shows (and as will be discussed below), this would more than suffice to ensure the Trust Fund would remain in surplus for the foreseeable future.  There would then be no need to consider slashing Social Security benefits in 2034.

The Trump tax plan was submitted to Congress on September 27.  It is actually inaccurate to call it simply the Trump tax plan as it was worked out over many months of discussions between Trump and his chief economic aides on one side, and the senior Republican leadership in both the Senate and the Congress on the other side, including the chairs of the tax-writing committees.  This was the so-called “Gang of Six”, who jointly released the plan on September 27, with the full endorsement of all.  But for simplicity, I will continue to call it the Trump tax plan.

The tax plan would sharply reduce government revenues.  The Tax Policy Center (TPC), a respected bipartisan nonprofit, has provided the most careful forecast of the revenue losses yet released.  They estimated that the plan would reduce government revenues by $2.4 trillion between 2018 and 2027, with this rising to a $3.2 trillion loss between 2028 and 2037.  The lost revenue would come to 0.9% of GDP for the 2018 to 2027 period, and 0.8% of GDP for the 2028 to 2037 period (some of the tax losses under the Trump plan are front-loaded), based on the GDP forecasts of the Social Security Trustees 2017 Annual Report (discussed below).  While less than 1% of GDP might not sound like much, such a revenue loss would be significant.  As we will see, it would suffice to ensure the Social Security Trust Fund would remain fully funded.

The chart at the top of this post shows what could be done.  The curve in green is the base case where nothing is done to shore up the Trust Fund.  It shows what the total stock of funds in the Social Security Trust Fund have been (since 1980) and would amount to, as a share of GDP, if full beneficiary payments would continue as per current law.  Note that I have included here the trust funds for both Old-Age and Survivors Insurance (OASI) and for Disability Insurance (DI).  While technically separate, they are often combined (and then referred to as OASDI).

The figures are calculated from the forecasts released in the most recent (July 2017) mandated regular annual report of the Board of Trustees of the Social Security system.  Their current forecast is that the Trust Fund would run out by around 2034, as seen in the chart.

But suppose that instead of enacting the Trump tax plan proposals, Congress decided to dedicate to the Social Security Trust Funds (OASDI) the revenues that would be lost as a consequence of those tax cuts?  The curve in the chart shown in red is a forecast of what those tax revenue losses would be each year, as a share of GDP.  These are the Tax Policy Center estimates, although extrapolated.  The TPC forecasts as published showed the estimated year-by-year losses over the first ten years (2018 to 2027), but then only for the sum of the losses over the next ten years (2028 to 2037).  I assumed a constant rate of growth from the estimate for 2027 sufficient to generate the TPC sum for 2028 to 2037, which worked out to a bit over 6.1%.  I then assumed the revenue losses would continue to grow at this rate for the remainder of the forecast period.

Note this 6.1% growth is a nominal rate of growth, reflecting both inflation and real growth.  The long-run forecasts in the Social Security Trustees report were for real GDP to grow at a rate of 2.1 or 2.2%, and inflation (in terms of the GDP price index) to grow at also 2.2%, leading to growth in nominal GDP of 4.3 or 4.4%.  Thus the forecast tax revenue losses under the Trump plan would slowly climb over time as a share of GDP, reaching 2% of GDP by about 2090.  This is as one would expect for this tax plan, as the proposals would reduce progressivity in the tax system.  As I noted before on this blog and will discuss further below, most of the benefits under the Trump tax plan would accrue to those with higher incomes.  However, one should also note that the very long-term forecasts for the outer years should not be taken too seriously.  While the trends are of interest, the specifics will almost certainly be different.

If the tax revenues that would be lost under the Trump tax plan were instead used to shore up the Social Security Trust Fund, one would get the curve shown in blue (which includes the interest earned on the balance in the Fund, at the interest rates forecast in the Trustees report).  The balance in the fund would remain positive, never dipping below 12% of GDP, and then start to rise as a share of GDP.  Even if the TPC forecasts of the revenues that would be lost under the Trump plan are somewhat off (or if Congress makes changes which will reduce somewhat the tax losses), there is some margin here.  The forecast is robust.

The alternative is to follow the Trump tax plan, and cut taxes sharply.  As I noted in my earlier post on this blog on the Trump tax plan, the proposals are heavily weighted to provisions which would especially benefit the rich.  The TPC analysis (which I did not yet have when preparing my earlier blog post) has specific estimates of this.  The chart below shows who would get the tax cuts for the forecast year of 2027:

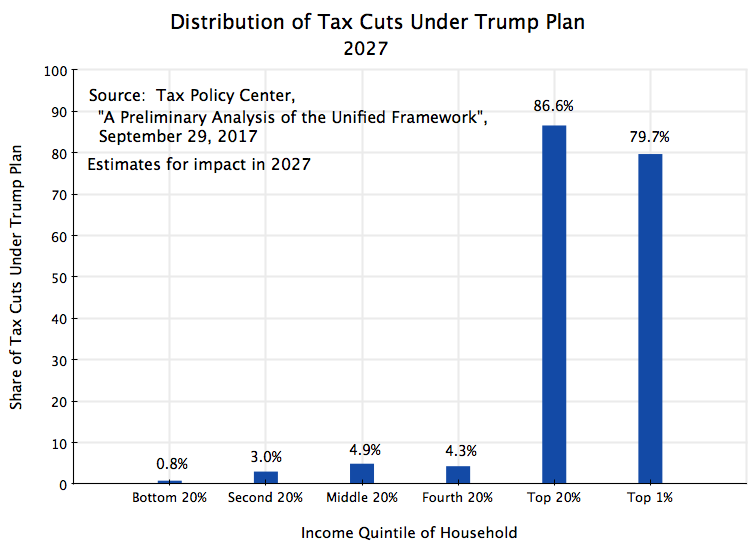
The estimate is that 87% of the tax revenues lost under the Trump plan would go to the richest 20% of the population (those households with an income of $154,900 or more in 2027, in prices of 2017).  And indeed, almost all of this (80% of the overall total) would accrue just to the top 1%.  The top 1% are already pretty well off, and it is not clear why tax cuts focused on them would spur greater effort on their part or greater growth.  The top 1% are those households who would have an annual income of at least $912,100 in 2027, in prices of 2017.  Most of them would be making more than a million annually.

The Trump people, not surprisingly, do not accept this.  They assert that the tax cuts will spur such a rapid acceleration in growth that tax revenues will not in fact be lost.  Most economists do not agree.  As discussed in earlier posts on this blog, the historical evidence does not support the Trumpian view (the tax cuts under Reagan and Bush II did not lead to any such acceleration in growth; what they did do is reduce tax revenues); the argument that tax cuts will lead to more rapid growth is also conceptually confused and reveals a misunderstanding of basic economics; and with the economy having already reached full employment during the Obama years, there is little basis for the assertion that the economy will now be able to grow at even 3% a year on average (over a mulit-year period) much less something significantly faster.  Tax cuts have in the past led to cuts in tax revenues collected, not to increases, and there is no reason to believe this time will be different.

Thus Congress faces a choice.  It can approve the Trump tax plan (already endorsed by the Republican leadership in both chambers), with 80% of the cuts going to the richest 1%.  Or it could use those revenues to shore up the Social Security Trust Fund.  If the latter is done, the Trust Fund would not run out in 2034, and Social Security would be able to continue to pay amounts owed to retired senior citizens and their survivors, as well as to the disabled, in accordance with the commitments it has made.

I would favor the latter.  If you agree, please call or write your Senator and Member of Congress, and encourage others to do so as well.

————————————————————————

Update, October 22, 2017

The US Senate passed on October 19 a budget framework for the FY2018-27 period which would allow for $1.5 trillion in lost tax revenues over this period, and a corresponding increase in the deficit, as a consequence of new tax legislation.  It was almost fully a party line vote (all Democrats voted against it, while all Republicans other than Senator Rand Paul voted in favor).  Importantly, this vote cleared the way (under Senate rules) for it to pass a new tax law with losses of up to $1.5 trillion over the decade, and pass this with only Republican votes.  Only 50 votes in favor will be required (with Vice President Pence providing a tie-breaking vote if needed).  Democrats can be ignored.

The loss in tax revenues in this budget framework is somewhat less than the $2.4 trillion that the Tax Policy Center estimates would follow in the first decade under the Trump tax plan.  But it is still sizeable, and it is of interest to see what this lesser amount would achieve if redirected to the Social Security Trust Fund instead of being used for tax cuts.

The chart above shows what would follow.  It still turns out that the Social Security Trust Fund would be saved from insolvency, although just barely this time.

One has to make an assumption as to what would happen to tax revenues after 2027, as well as for what the time pattern would be for the $1.5 trillion in losses over the ten years from FY2018 to 27.  With nothing else available, I assumed that the losses would grow over time at the same rate as what is implied in the Tax Policy Center estimates for the losses in the second decade of the Trump tax plan as compared to the losses in the final year of the first decade.  As discussed above, these estimates implied a nominal rate of growth of 6.1% a year.  I assumed the same rate of growth here, including for the year to year growth in the first decade (summing over that decade to $1.5 trillion).

The result again is that the Social Security Trust Fund would remain solvent for the foreseeable future, although now just marginally.  The Trust Fund (as a share of GDP) would just touch zero in the years around 2080, but would then start to rise.

We therefore have a choice.  The Republican-passed budget framework has that an increase in the fiscal deficit of $1.5 trillion over the next decade is acceptable.  It could be used for tax cuts that would accrue primarily to the rich.  Or it could be used to ensure the Social Security system will be able, for the foreseeable future, to keep to its commitments to senior citizens, to their survivors, and to the disabled.


Lower Corporate Taxes Have Not Led to Higher Real Wages

A recently released report from the president’s Council of Economic Advisers (CEA) claims that cutting the headline corporate income tax rate from the current 35% to 20% would lead to a jump in the real incomes of American households by a minimum of $4,000 a year and possibly by as much as $9,000.  Others have criticized those forecasts for a variety of reasons, and Larry Summers has called the estimates “absurd”.

Indeed, they are absurd.  One way to see this is by looking at the historical evidence.  This is not the first time the US would cut its corporate tax rates.  Did such cuts in the past then lead to a jump in real wages?  As the chart above suggests, the answer is no.  This blog post will discuss that evidence, as well as other issues with the CEA analysis prepared under (and it appears largely by) its new chair Kevin Hassett.  But first some background on the CEA and its new chair, and what this recent incident portends for the Council and its previous reputation for professionalism.

The Council of Economic Advisers has, until now, been a highly respected office in the White House, set up to provide the president with objective and professional economic advice on the key economic issues of the day.  The Council was established in 1946 during the Truman administration, and has had as its chair and its members many illustrious and well-respected economists.  A number later received the Nobel Prize in Economics and similar awards.  While the CEA can be and has been political at times (it is located in the Office of the President, after all), it has had an able staff who were expected to provide professional assessments of the issues as a service to the president.  Many came on leave from academic posts.  As an example of the type of staff they could draw, both Larry Summers and Paul Krugman, then young and rising economists, were on the Council staff in the early 1980s during the Reagan administration.

The current chair is Kevin Hassett.  Trump did not nominate someone to the position until April, and Hassett took up his post (following Senate approval) only on September 13.  Prior to this post, Hassett was perhaps best known for co-authoring (with James K. Glassman) the 1999 book titled “Dow 36,000”, in which he forecast the Dow Jones Industrial Average would reach 36,000 by 2002 and certainly no later than by 2004.  In the event, the Dow never exceeded 11,750 (in January 2000) and dropped to 7,200 in October 2002, as the Bush administration’s first recession took hold.

Hassett has now, as one of his first official acts, released a formal CEA study that claims that if the Trump Tax Plan were enacted, with the headline corporate income tax cut from 35% to 20%, household incomes in the US would rise by a minimum of $4,000 per year, and possibly by as much as $9,000.  Larry Summers has termed it “dishonest, incompetent, and absurd”, and other economists have been similarly scathing.

The study really is pretty bad, and must be an embarrassment to the CEA staff. The report starts (Figure 1) with a chart that shows average real wage growth over the last several years (2013 to 2016) among the 10 OECD member countries with the highest statutory corporate income tax rates, as compared to that for the 10 OECD members with the lowest rates.  Between 2013 and 2016 (but essentially just in 2015) the wage growth was higher by a few percentage points in the set of OECD countries with the lower tax rates.  But the 10 OECD member countries with the lowest corporate tax rates were mostly countries from Central and Eastern Europe (Estonia, Latvia, and so on to Slovenia).  They were starting from lower wage rates than in the richer countries, and benefited as they opened up to globalization and in particular to the EU markets.  It is difficult to see how this simplistic correlation tells us much about what would happen if the US cut its corporate income tax rate.

Hassett then quantifies his estimate of the dollar gains per household by citing a number of obscure articles (several of which were never published in a peer-reviewed journal) to come up with estimates of possible elasticities (explained below) that relate how much household incomes would rise if corporate taxes were cut.  He concludes this review by asserting that an elasticity in the range of -0.16 to -0.33 would be reasonable, in his view.  The -0.16 figure came from a study from 2009 published in the “Federal Reserve Bank of Kansas City Economic Review”.  That is not exactly a prestigious journal.  And the -0.33 figure came from a 2007 paper that was presented at a conference, and does not appear to have ever been published.

An elasticity of -0.16 means that if the corporate tax rate were cut by 1% (not 1 percentage point, but rather by actually 1%, e.g. from 35% to 34.65%), then real wages would rise by 0.16%.  A 10% cut in the corporate tax rates (e.g. 35% to 31.5%) would lead, according to this assumption, to real wages rising by 1.6%.  And a cut in the corporate income tax rate from 35% to 20% (a 43% fall), as proposed in the Trump tax plan, would raise real wages by 6.9% under this assumption.  Hassett then applies this to the wage portion of household incomes to arrive at his calculated gain of $4,000 per household.  And the $9,000 gain is based on assuming an elasticity of -0.33.

There are numerous problems with this analysis, starting with the assumption that correlations are the same as causation.  There is also a question of what correlations are relevant.  The study that came up with the -0.33 elasticity, for example, looked at correlations across a panel of 50 countries.  It is not clear that such correlations would be of much relevance to judging the impact on real wages of a change in the US on corporate tax rates, as real wages across such a range of countries are driven by many factors (including, not least, the level of development).  And the -0.16 elasticity came from a study that examined correlations between real wages and corporate tax rates across the different states of the US.  But labor is mobile across US states, as is capital, plus the range of variation (state to state) in corporate tax rates is relatively modest as state taxes are relatively modest in size.  And indeed, it is not even clear how many companies actually pay the headline corporate income tax rates on the books, as states routinely grant them special tax holidays and other favors in order to try to get them to move to their states.

One would have thought that the most interesting investigation as to whether changes in corporate income taxes would matter in the US to real wages, would have been to see what actually happened in the US when such rates were cut in the past.  The fact that Hassett ignored this obvious question in the new CEA report is telling.  And there have indeed been earlier changes in the corporate tax rate, most notably (in recent decades) in 1987/88, following from the Tax Reform Act of 1986 during the Reagan administration.

The impact (or rather the lack of it) can be seen in the chart at the top of this post.  As had been discussed in earlier posts on this blog, real wages have been stagnant in the US (for the median wage earner) since around 1980.  The chart at the top of this post is an update of one prepared for a post from February 2015 that looked at the proximate causes of stagnant wages over this period, despite growth of real GDP per capita of more than 80% over the period.  While real GDP per capita is now 82% above what it was at the start of 1979, real wages (as measured by real median weekly earnings of full-time workers) are just 5.7% above where they were at the start of 1979.  Furthermore, the current “peak” of 5.7% growth can all be attributed to growth in the period since mid-2014, as the economy finally approached full employment levels in the later years of the Obama administration (having been held back by government spending cuts from 2010), with this carrying over into 2017.

The top corporate tax rate on profits was cut from 46% in the years up through 1986, to 40% in 1987 and then to just 34% in 1988 and thereafter to 1993 (when it was raised to the current level of 35%).  Did the cuts in 1987/88 lead to a sharp jump in real wages?  There is no indication of that at all in the chart.  Indeed, real wages fell by close to 6% between late 1986 and 1990, and then stayed at close to that low level until they started to rise some in the mid to late 1990s.  And there is no indication that the small increase in the corporate tax rate in 1993 to 35% led to wages then declining – indeed, they started to rise a few years later.

Based on this, one might come to the conclusion that a cut in corporate tax rates will lead to a fall (not an increase) in real wages, as seen following the 1987/88 cuts.  And also that a modest rise in the tax rate (such as in 1993) would lead to a gain in real wages a few years later.  But I would not claim this.  Rather, I would say that real wages and corporate tax rates are simply not closely linked to one another.  But for Hassett and others to claim that cuts in corporate taxes will lead to a significant jump in real wages, the exact opposite outcome following the 1987/88 cuts needs to be explained.

The CEA report was badly done, and must be an embarrassment to the professional staff there who certainly know better.  And as Larry Summers remarked in his blog post:  “Considering all this, if a Ph.D student submitted the CEA analysis as a term paper in public finance, I would be hard pressed to give it a passing grade.”

An Analysis of the Trump Tax Plan: Not a Tax Reform, But Rather a Massive Tax Cut for the Rich

A.  Introduction

The Trump administration released on September 27 its proposed tax plan.  It was exceedingly skimpy (only nine pages long, including the title page, and with all the white space could have been presented on half that number of pages).  Importantly, it was explicitly vague on many of the measures, such as what tax loopholes would be closed to partially pay for the tax cuts (simply saying they would do this somehow).  One can, however, examine measures that were explicitly presented, and from these it is clear that this is primarily a plan for massive tax cuts for the rich.

It is also clear that this is not a tax reform.  A tax reform would be revenue neutral.  The measures proposed would not be.  And a reform would focus on changes in the structure of the tax system.  There is little of that here, but rather proposals to cut various tax rates (including in several cases to zero), primarily for the benefit of those who are well off.

One can see this in the way the tax plan was approached.  In a true tax reform, one would start by examining the system, and whether certain deductions and tax exemptions are not warranted by good policy (but rather serve only certain vested interests).  Closing such loopholes would lead to higher revenues being collected.  One would then determine what the new tax rates could be (i.e. by how much they could be cut) to leave the overall level of tax collection the same.

But that was not done here.  Rather, they start with specific proposals on what the new tax rates “should” be (12%, 25%, and 35% for individuals, and 20% for corporations), and then make only vague references to certain, unspecified, deductions and tax exemptions being eliminated or reduced, in order not to lose too much in revenues (they assert).  They have the process backward.

And it is clear that these tax cuts, should they be enacted by Congress, would massively increase the fiscal deficit.  While it is impossible to come up with a precise estimate of how much the tax plan would cost in lost revenues, due to the vagueness on the parameters and on a number of the proposals, Republicans have already factored into the long-term budget a reduction in tax revenues of $1.5 trillion over ten years.  And estimates of the net cost of the Trump plan range from a low of $2.2 trillion over ten years ($2.7 trillion when additional interest is counted, as it should be), to as high as $5 trillion over ten years.  No one can really say as yet, given the deliberate lack of detail.

But any of these figures on the cost are not small.  The total federal debt held by the public as of the end of September, 2017, was $14.7 trillion.  The cost in lost revenue could equal more than a third of this.  Yet Republicans in Congress blocked the fiscal expenditures we desperately needed in the years from 2010 onwards during the Obama years, when unemployment was still high, there was excess capacity in our underutilized factories, and the country needed to rebuild its infrastructure (as we still do).  The argument then was that we could not add to our national debt.  But now the same politicians see no problem with adding massively to that debt to cover tax cuts that will primarily benefit the rich.  The sheer hypocrisy is breath-taking.

Not surprisingly, Trump officials are saying that there will be no such cost due to a resulting spur to our economic growth.  Trump himself asserted that his tax plan would lead the economy to grow at a 6% pace.  No economist sees this as remotely plausible.  Even Trump’s economic aides, such as Gary Cohn who was principally responsible for the plan, are far more cautious and say only that the plan will lead to growth of “substantially over 3 percent”.  But even this has no basis in what has been observed historically after the Reagan and Bush tax cuts, nor what one would expect from elementary economic analysis.

The lack of specificity in many of the proposals in the tax plan issued on September 27 makes it impossible to assess it in full, as major elements are simply only alluded to.  For example, it says that a number of tax deductions (both personal and corporate) will be eliminated or reduced, but does not say which (other than that they propose to keep the deductions for home mortgage interest and for charity).  As another example, the plan says the number of personal income tax brackets would be reduced from seven currently to just three broad ones (at 12%, 25%, and 35%), but does not say at what income levels each would apply.  Specifics were simply left out.

For a tax plan where work has been intensively underway for already the eight months of this administration (and indeed from before, as campaign proposals were developed), such vagueness must be deliberate.  The possible reasons include:  1) That the specifics would be embarrassing, as they would make clear the political interests that would gain or lose under the plan; 2) That revealing the specifics would spark immediate opposition from those who would lose (or not gain as others would); 3) That revealing the specifics would make clear that they would not in fact suffice to achieve what the Trump administration is asserting (e.g. that ending certain tax deductions will make the plan progressive, or generate revenues sufficient to offset the tax rate cuts); and/or 4) That they really do not know what to do or what could be done to fix the issue.

One can, however, look at what is there, even if the overall plan is incomplete.  This blog post will do that.

B.  Personal Income Taxes

The proposals are (starting with those which are most clear):

a)  Elimination of the Estate Tax:  Only the rich pay this.  It only applies to estates given to heirs of $10.98 million or more (for a married couple).  This only affects the top 0.2%, most wealthy, households in the US.

b)  Elimination of the Alternative Minimum Tax:  This also only applies to those who are rich enough for it to apply and who benefit from a range of tax deductions and other benefits, who would otherwise pay little in tax.  It would be better to end such tax deductions and other special tax benefits that primarily help this group, thus making the Alternative Minimum Tax irrelevant, than to end it even though it had remained relevant.

c)  A reduction in the top income tax rate from 39.6% to 35%:  This is a clear gain to those whose income is so high that they would, under the current tax brackets, owe tax at a marginal rate of 39.6%.  But this bracket only kicks in for households with an adjusted gross income of $470,700 or more (in 2017).  This is very close to the minimum income of those in the top 1% of the income distribution ($465,626 in 2014), and the average household income of those in that very well-off group was $1,260,508 in 2014.  Thus this would be a benefit only to the top 1%, who on average earn over $1 million a year.

The Trump plan document does include a rather odd statement that the congressional tax-writing committees could consider adding an additional, higher, tax bracket, for the very rich, but it is not at all clear what this might be.  They do not say.  And since the tax legislation will be written by the congressional committees, who are free to include whatever they choose, this gratuitous comment is meaningless, and was presumably added purely for political reasons.

d)  A consolidation in the number of tax brackets from seven currently to just three, of 12%, 25%, and 35%:  Aside from the clear benefit to those now in the 39.6% bracket, noted above, one cannot say precisely what the impact the new tax brackets would have for the other groups since the income levels at which each would kick in was left unspecified.  It might have been embarrassing, or contentious, to do so.  But one can say that any such consolidation would lead to less progressivity in the tax system, as each of the new brackets would apply to a broader range of incomes.  Instead of the rates rising as incomes move up from one bracket to the next, there would now be a broader range at which they would be kept flat.  For example, suppose the Trump plan would be for the new 25% rate to span what is now taxed at 25% or 28%.  That range would then apply to household incomes (for married couples filing jointly, and in 2017) from $75,900 on the low end to $233,350 at the high end.  The low-end figure is just above the household income figure of $74,869 (in 2016) for those reaching the 60th percentile of the income distribution (see Table A-2 of this Census Bureau report), while the top-end is just above the $225,251 income figure for those reaching the 95th percentile.  A system is not terribly progressive when those in the middle class (at the 60th percentile) pay at the same rate as those who are quite well off (in the 95th percentile).

e)  A ceiling on the tax rate paid on personal income received through “pass-through” business entities of just 25%:  This would be one of the more regressive of the measures proposed in the Trump tax plan (as well as one especially beneficial to Trump himself).  Under current tax law, most US businesses (95% of them) are incorporated as business entities that do not pay taxes at the corporate level, but rather pass through their incomes to their owners or partners, who then pay tax on that income at their normal, personal, rates.  These so-called “pass-through” business entities include sole proprietorships, partnerships, Limited Liability Companies (LLCs), and sub-chapter S corporations (from the section in the tax code).  And they are important, not only in number but also in incomes generated:  In the aggregate, such pass-through business entities generate more in income than the traditional large corporations (formally C corporations) that most people refer to when saying corporation.  C corporations must pay a corporate income tax (to be discussed below), while pass-through entities avoid such taxes at the company level.

The Trump tax plan would cap the tax rate on such pass-through income at 25%.  This would not only create a new level of complexity (a new category of income on which a different tax is due), but would also only be of benefit to those who would otherwise owe taxes at a higher rate (the 35% bracket in the Trump plan).  If one were already in the 25% bracket, or a lower one, that ceiling would make no difference at all and would be of no benefit.  But for those rich enough to be in the higher bracket, the benefit would be huge.

Who would gain from this?  Anyone who could organize themselves as a pass-through entity (or could do so in agreement with their employer).  This would include independent consultants; other professionals such as lawyers, lobbyists, accountants, and financial advisors; financial entities and the partners investing in private-equity, venture-capital, and hedge funds; and real estate developers.  Trump would personally benefit as he owns or controls over 500 LLCs, according to Federal Election Commission filings.  And others could reorganize into such an entity when they have a tax incentive to do so.  For example, the basketball coach at the University of Kansas did this when Kansas created such a loophole for what would otherwise be due under its state income taxes.

f)  The tax cuts for middle-income groups would be small or non-existent:  While the Trump tax proposal, as published, repeatedly asserts that they would reduce taxes due by the middle class, there is little to suggest in the plan that that would be the case.  The primary benefit, they tout (and lead off with) is a proposal to almost double the standard deduction to $24,000 (for a married couple filing jointly).  That standard deduction is currently $12,700.  But the Trump plan would also eliminate the personal exemption, which is $4,050 per person in 2017.  Combining the standard deduction and personal exemptions, a family of four would have $28,900 of exempt income in 2017 under current law ($12,700 for the standard deduction, and personal exemptions of four times $4,050), but only $24,000 under the Trump plan.  They would not be better off, and indeed could be worse off.  The Trump plan is also proposing that the child tax credit (currently a maximum of $1,000 per child, and phased out at higher incomes) should be raised (both in amount, and at the incomes at which it is phased out), but no specifics are given so one cannot say whether this would be significant.

g)  Deduction for state and local taxes paid:  While not stated explicitly, the plan does imply that the deduction for state and local taxes paid would be eliminated.  It also has been much discussed publicly, so leaving out explicit mention was not an oversight.  What the Trump plan does say is the “most itemized deductions” would be eliminated, other than the deductions for home mortgage interest and for charity.

Eliminating the deduction for state and local taxes appears to be purely political.  It would adversely affect mostly those who live in states that vote for Democrats.  And it is odd to consider this tax deduction as a loophole.  One has to pay your taxes (including state and local taxes), or you go to jail.  It is not something you do voluntarily, in part to benefit from a tax deduction.  In contrast, a deduction such as for home mortgage interest is voluntary, one benefits directly from buying and owning a nice house, and such a deduction benefits more those who are able to buy a big and expensive home and who qualify for taking out a large mortgage.

h)  Importantly, there was much that was not mentioned:  One must also keep in mind what was not mentioned and hence would not be changed under the Trump proposals.  For example, no mention was made of the highly favorable tax rates on long-term capital gains (for assets held one year or more) of just 20%.  Those with a high level of wealth, i.e. the wealthy, gain greatly from this.  Nor was there any mention of such widely discussed loopholes as the “carried interest” exception (where certain investment fund managers are able to count their gains from the investment deals they work on as if it were capital gains, rather than a return on their work, as it would be for the lawyers and accountants on such deals), or the ability to be paid in stock options at the favorable capital gains rates.

C.  Corporate Income Taxes

More than the tax cuts enacted under Presidents Reagan and Bush, the Trump tax plan focuses on cuts to corporate income (profit) taxes.  Proposals include:

a)  A cut in the corporate income tax rate from the current 35% to just 20%:  This is a massive cut.  But it should also be recognized that the actual corporate income tax paid is far lower than the headline rate.  As noted in an earlier post on this blog, the actual average rate paid has been coming down for decades, and is now around 20%.  There are many, perfectly legal, ways to circumvent this tax.  But setting the rate now at 20% will not mean that taxes equal to 20% of corporate profits will be collected.  Rather, unless the mechanisms used to reduce corporate tax liability from the headline rate of 35% are addressed, those mechanisms will be used to reduce the new collections from the new 20% headline rate to something far less again.

b)  Allow 100% of investment expenses to be deducted from profits in the first year, while limiting “partially” interest expense on borrowing:  This provision, commonly referred to as full “expensing” of investment expenditures, would reduce taxable profits by whatever is spent on investment.  Investments are expected to last for a number of years, and under normal accounting the expense counted is not the full investment expenditure but rather only the estimated depreciation of that investment in the current year.  However, in recent decades an acceleration in what is allowed for depreciation has been allowed in the tax code in order to provide an additional incentive to invest.  The new proposal would bring that acceleration all the way to 100%, which as far as it can go.

This would provide an incentive to invest more, which is not a bad thing, although it still would also have the effect of reducing what would be collected in corporate income taxes.  It would have to be paid for somehow.  The Trump proposal would partially offset the cost of full expensing of investments by limiting “partially” the interest costs on borrowing that can be deducted as a cost when calculating taxable profits.  The interest cost of borrowing (on loans, or bonds, or whatever) is currently counted in full as an expense, just like any other expense of running the business.  How partial that limitation on interest expenses would be is not said.

But even if interest expenses were excluded in full from allowable business expenses, it is unlikely that this would come close to offsetting the reduction in tax revenues from allowing investment expenditures to be fully expensed.  As a simple example, suppose a firm would make an investment of $100, in an asset that would last 10 years (and with depreciation of 10% of the original cost each year).  For this investment, the firm would borrow $100, on which it pays interest at 5%.  Under the current tax system, the firm in the first year would deduct from its profits the depreciation expense of $10 (10% of $100) plus the interest cost of $5, for a total of $15.  Under the Trump plan, the firm would be able to count as an expense in the first year the full $100, but not the $5 of interest.  That is far better for the firm.  Of course, the situation would then be different in the second and subsequent years, as depreciation would no longer be counted (the investment was fully expensed in the first year), but it is always better to bring expenses forward.  And there likely will be further investments in subsequent years as well, keeping what counts as taxable profits low.

c)  Tax amnesty for profits held abroad:  US corporations hold an estimated $2.6 trillion in assets overseas, in part because overseas earnings are not subject to the corporate income tax until they are repatriated to the US.  Such a provision might have made sense decades ago, when information systems were more primitive, but does not anymore.  This provision in the US tax code creates the incentive to avoid current taxes by keeping such earnings overseas.  These earnings could come from regular operations such as to sell and service equipment for foreign customers, or from overseas production operations.  Or such earnings could be generated through aggressive tax schemes, such as from transferring patent and trademark rights to overseas jurisdictions in low-tax or no-tax jurisdictions such as the Cayman Islands.  But whichever way such profits are generated, the US tax system creates the incentive to hold them abroad by not taxing them until they are repatriated to the US.

This is an issue, and could be addressed directly by changing the law to make overseas earnings subject to tax in the year the earnings are generated.  The tax on what has been accumulated in the past could perhaps be spread out equally over some time period, to reduce the shock, such as say over five years.  The Trump plan would in fact start to do this, but only partially as the tax on such accumulated earnings would be set at some special (and unannounced) low rates.  All it says is that while both rates would be low, there would be a lower rate applied if the foreign earnings are held in “illiquid” assets than in liquid ones.  Precisely how this distinction would be defined and enforced is not stated.

This would in essence be a partial amnesty for capital earnings held abroad.  Companies that have held their profits abroad (to avoid US taxes) would be rewarded with a huge windfall from that special low tax rate (or rates), totalling in the hundreds of billions of dollars, with the precise gain on that $2.6 trillion held overseas dependant on how low the Trump plan would set the tax rates on those earnings.

It is not surprising that US corporations have acted this way.  There was an earlier partial amnesty, and it was reasonable for them to assume there would be future ones (as the Trump tax plan is indeed now proposing).  In one of the worst pieces of tax policy implemented in the George W. Bush administration, an amnesty approved in 2004 allowed US corporations with accumulated earnings abroad to repatriate that capital at a special, low, tax rate of just 5.25%.  It was not surprising that the corporations would assume this would happen again, and hence they had every incentive to keep earnings abroad whenever possible, leading directly to the $2.6 trillion now held abroad.

Furthermore, the argument was made that the 2004 amnesty would lead the firms to undertake additional investment in the US, with additional employment, using the repatriated funds.  But analyses undertaken later found no evidence that that happened.  Indeed, subsequent employment fell at the firms that repatriated accumulated overseas earnings.  Rather, the funds repatriated largely went to share repurchases and increased dividends.  This should not, however, have been surprising.  Firms will invest if they have what they see to be a profitable opportunity.  If they need funds, they can borrow, and such multinational corporations generally have no problem in doing so.  Indeed, they can use their accumulated overseas earnings as collateral on such loans (as Apple has done) to get especially low rates on such loans.  Yet the Trump administration asserts, with no evidence and indeed in contradiction to the earlier experience, that their proposed amnesty on earnings held abroad will this time lead to more investment and jobs by these firms in the US.

d)  Cut to zero corporate taxes on future overseas earnings:  The amnesty discussed above would apply to the current stock of accumulated earnings held by US corporations abroad.  Going forward, the Trump administration proposes that earnings of overseas subsidiaries (with ownership of as little as 10% in those firms) would be fully exempt from US taxes.  While it is true that there then would be no incentive to accumulate earnings abroad, the same would be the case if those earnings would simply be made subject to the same current year corporate income taxes as the US parent is liable for, and not taxable only when those earnings are repatriated.

It is also not at all clear to me how exempting these overseas earnings from any US taxes would lead to more investment and more jobs in the US.  Indeed, the incentive would appear to me to be the opposite.  If a plant is sited in the US and used to sell product in the US market or to export it to Europe or Asia, say, earnings from those operations would be subject to the regular US corporate income taxes (at a 20% rate in the Trump proposals).  However, if the plant is sited in Mexico, with the production then sold in the US market or exported from there to Europe or Asia, earnings from those operations would not be subject to any US tax.  Mexico might charge some tax, but if the firm can negotiate a good deal (much as firms from overseas have negotiated such deals with various states in the US to site their plants in those states), the Trump proposal would create an incentive to move investment and jobs to foreign locations.

D.  Conclusion

The Trump administration’s tax plan is extremely skimpy on the specifics.  As one commentator (Allan Sloan) noted, it looks like it was “written in a bar one evening over a batch of beers for a Tax 101 class rather than by serious people who spent weeks working with tax issues”.

It is, of course, still just a proposal.  The congressional committees will be the ones who will draft the specific law, and who will then of necessity fill in the details.  The final product could look quite different from what has been presented here.  But the Trump administration proposal has been worked out during many months of discussions with the key Republican leaders in the House and the Senate who will be involved.  Indeed, the plan has been presented in the media not always as the Trump administration plan, but rather the plan of the “Big Six”, where the Big Six is made up of House Speaker Paul Ryan, Senate Majority Leader Mitch McConnell, House Ways and Means Committee Chairman Kevin Brady, Senate Finance Committee Chairman Orrin Hatch, plus National Economic Council Director Gary Cohn and Treasury Secretary Steven Mnuchin of the Trump administration.  If this group is indeed fully behind it, then one can expect the final version to be voted on will be very similar to what was outlined here.

But skimpy as it is, one can say with some certainty that the tax plan:

a)  Will be expensive, with a ten-year cost in the trillions of dollars;

b)  Is not in fact a tax reform, but rather a set of very large tax cuts;

and c)  Overwhelmingly benefits the rich.