The Republican Tax Plan: Government Debt Will Rise by More Than the $1.0 Trillion Commonly Cited

A.  Introduction

News reports are saying that the Senate Republican tax plan, rushed through and passed on a 51 to 49 vote late on a Friday night (actually, at 2 am on Saturday), will add an estimated $1.0 trillion to the national debt over the next ten years.  The number is based on figures provided in a staff report from the Joint Committee on Taxation (JCT) of Congress on the estimated tax revenue impacts.  But that is not what the JCT numbers say.  The actual increase in the federal debt will be almost a quarter more than that $1.0 trillion figure, even taking the JCT estimates as fine.  The problem is that they are being misinterpreted.

The JCT acts as a professional staff responsible for assessing the impacts of tax proposals before Congress (on behalf of both the Senate and the House), and must act in accord with instructions provided by the Congressional leadership.  They have traditionally worked out the revenue implications of the proposals sent to them (normally on a year by year basis over a ten-year horizon) as well as the distributional implications (what will be the effects by income group).  When Republicans took control of both the Senate and the House following the 2012 elections, JCT staff were also directed to provide what has been labeled “dynamic scoring”, which attempts to come up with an estimate of how economic growth may be affected and the revenue implications of that.  The assumption is that tax cuts will spur growth, and that with higher growth there will be an increase in tax revenues which would then (partially or possibly fully) offset what the revenue losses would otherwise be as a result of the tax cuts.

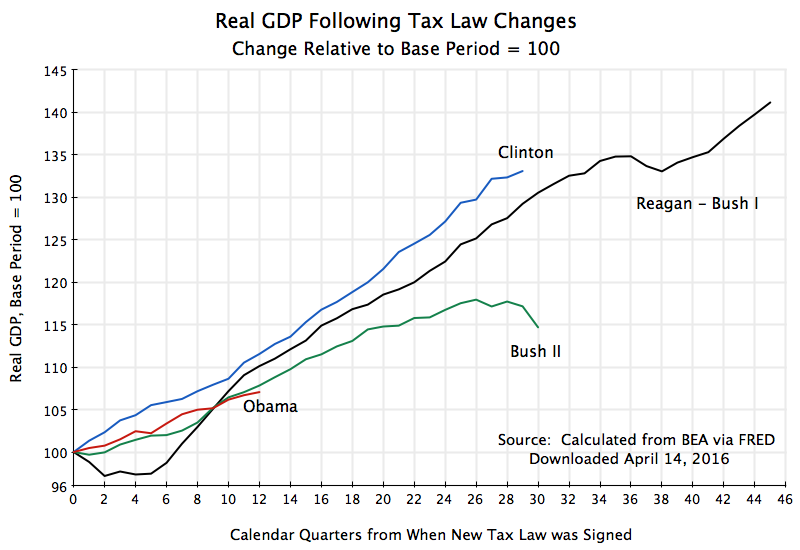
This is the old “supply-side economics”, which politicians starting with Reagan would cite as saying that tax cuts can pay for themselves.  The reality has been far different, as previous posts on this blog have argued.  The tax cuts of Reagan and Bush were followed by higher deficits, and slower (or at least not faster) growth than what followed after the tax increases approved under Clinton and Obama.  A fair reading of these experiences would not be that tax increases are good for growth and tax cuts bad for growth, but rather that the impacts, whatever they are, are too small to see in the data.

But the JCT staff are now required to provide some such estimate, and to do this they have to use economic models.  The constraints of such an approach will be discussed below.  But there is also a separate issue, which has unfortunately been confused with the impact of the growth estimates.  The issue is that the figures being provided by the JCT, on the year by year impact on tax revenues of the tax plan, are being confused with how far government debt will rise as a result of those tax losses.  Reporters are adding up the year by year tax revenue impacts over the ten year period of the forecasts, and concluding that that total will equal the resulting increase in government debt.  But that is not correct.  That simple addition of the year by year figures on tax losses leaves out the additional interest that will need to be paid on the debt incurred to cover those now higher fiscal deficits.  That additional interest will be significant.

B.  The Impact of Increased Interest on the Addition to the Federal Debt

The black curve in the chart at the top of this post, rising to $1,414 billion by FY2027, shows the simple accumulation of the lost tax revenues (year by year) following from the Senate Republican tax plan (November 16 version, as assessed by the JCT on November 17).  While the final plan passed by the Senate was a bit different (loopholes were being added or expanded up to the final hours, with also some offsetting tax increases), the net change in revenues in the final, approved, bill was relatively small, at $34 billion over the ten years (raising the cost to $1,448 billion from the $1,414 billion cost the JCT had estimated for the earlier version).  The JCT estimates of the macro impacts based on the $1,414 billion total will be close to what it would have been had they had the time to assess the final plan.

That path leading to the $1,414 billion cost total reflects the simple sum of the year by year tax revenue losses as a result of the Republican tax plan.  But those revenue losses will lead to larger deficits.  The larger deficits will mean additional federal debt, and interest will have to be paid on that additional debt.

Such additional interest needs to be paid year by year, and will accumulate over time.  The blue curve at the top, rising to $1,717 billion, is an estimate of what this would be, using the June 2017 interest rate forecasts (on government debt) from the Congressional Budget Office, and assuming, conservatively, interest paid in arrears with a one-year lag.  The total is $300 billion higher than the $1,414 billion figure.  That is, under this scenario federal government debt would increase by $1,717 billion over what it would otherwise have been by FY2027, not by the $1,414 billion figure.  News reports commonly got this wrong.  It is not that the JCT got it wrong.  Rather, news reports misinterpreted what the JCT figures were saying.

The question then is whether there will be macro economy impacts, as the supply-siders assert, and if so, how large they would be.  The JCT provided on November 30, estimates of what these might be.  Based on a weighted average of results from three different economic models of the economy, the JCT estimated that at the end of the ten year period (i.e. in 2027), GDP would be 0.8% higher than it would be otherwise.  That is, the growth rate would on average be 0.08% per year higher than otherwise.  This is not much but still is something.  The resulting higher GDP would raise tax revenues above what they would otherwise be following the tax cuts.  Tax revenues would still decline – they just would not decline by as much as before.  Federal debt would still rise.  The higher deficits over the ten years would sum to $1,007 billion by 2027 (the green curve in the chart above).  And once again, news reports concluded that the new JCT figures were saying that federal debt would rise by $1.0 trillion over the ten year period once those macro impacts were taken into account.

But the JCT figures are not saying that.  They simply show the year by year impacts.  And as before, the JCT figures do not include the impact of the increase in interest that will need to be paid on a federal debt that would be higher than otherwise due to the tax cuts.  Adding in these interest payments, on a growing debt resulting from the yearly reduction in tax revenues in this tax plan, leads to the red curve in the chart.  The JCT figures imply, once one adds in the now higher interest payments due, a federal debt that by 2027 would be $1,245 billion higher than what it would otherwise be.  This is roughly a quarter higher, or an extra $240 billion, over the figure the news reports are citing.  This is not a small difference.

C.  Other Points

There are a few other points worth noting:

a)  One can see in the chart at the top of this post how the additions to the federal debt level off in 2026, and in most cases then decline.  This is because most of the provisions that would cut individual income taxes are ended as of the end of CY2025 under the Republican proposal.  The losses in tax revenues from the tax plan would then continue to grow through FY2026 (due to the overlap between CY2025 and FY2026, and the fact that final taxes due for CY2025 will be paid in April 2026) leading to still growing debt in 2026, but then level off or fall after that.  By FY2027, the JCT assessment found that most individuals would end up with higher taxes due.  Indeed, the Senate Republican tax plan is structured so that individuals in FY2027 would on average end up paying more in taxes than they would if this tax plan were never to go into effect.  In contrast to the sunsetting of the individual income tax cuts, the corporate income tax cuts would be made permanent.  And if, as the Republicans say they actually want, the individual income tax cuts are also made permanent, then the federal debt will grow by even more than what would result under the current plan.  They cannot have it both ways.

b)  Furthermore, while the focus here is on the impacts on total revenues collected and hence on the federal debt, there will also be critical distributional implications.  The JCT assessment of the November 16 version of the Republican tax plan found that if one adds together the impacts on households of all the proposals (on both the individual and the business side), that in 2027, those families with incomes of less than $75,000 would be paying more in taxes than they would if this tax plan were never approved (taking averages for each income group, as individual experiences will vary).  However, those with incomes of $75,000 or more would all be enjoying tax cuts.  The figures on a per family basis (technically per taxpayer unit) are shown in my earlier blog post on the Republican plan.  But it is not just in 2027 that certain income groups will be paying more in taxes.  Adding up the net impacts by income group over the full ten years, one finds that those with incomes of up to $30,000 will be paying more in taxes in total over the full ten years (of about $900 per family on average).  These are the families who are least able to afford a tax hike.

c)  It is important to clarify one statement in the JCT report on the macro impacts.  It makes reference to a $50 billion figure for “an increase in interest payments on the Federal debt”.  This is stated in the opening paragraph, and then in a bit more detail on page 6 in the section labeled “Budgetary effects”.  This increase in interest due is netted out in the figure summing to the $1,007 billion for the total cost over ten years of the Republican plan.

At first I had thought this interest cost reflected what I am discussing here – the increase in interest payments that will be due over the period as a result of the greater borrowing following from the higher deficits.  However, the $50 billion number is far too small, as the higher amount due in interest from the higher debt would be more like $240 billion.  I at first thought there might have been a mistake in the JCT calculations.  But a close reading of the JCT report shows that the $50 billion figure is actually referring to something else.  That something else is that one should expect general interest rates to rise in the economy as a result of the higher fiscal deficits, and that this will then lead to higher interest due on the existing federal government debt.  The increase in interest rates might be relatively small, but with the large government debt, even a small increase in interest rates can matter.  And one can calculate that a $50 billion increase in interest due would result from a rise in average interest rates on government debt of 0.025%, i.e. from the 3.7% that the CBO forecasts for most of this period, to 3.725%.

One must therefore not confuse the $50 billion in increased interest payments due on the existing federal debt (which the JCT estimates), with the increase in interest that will be due as a result of the year by year higher federal deficits, which must then be funded by borrowing.  The JCT, following the instructions given to it by the Congressional leadership, is not estimating the latter.  But the latter does add to the federal debt, and hence the addition to the federal debt by 2027 as a consequence of this Republican tax plan would be more like $1,245 billion than the $1,007 billion that the news media is mistakenly saying.

d)  As noted above, the JCT arrives at a forecast, based on the models it is using, that GDP would be 0.8% higher in 2027 than it would otherwise be.  The increase is small (increased growth of just 0.08% a year), but something.  News reports have made much of it.  But not noted (from what I have seen) is any discussion in the news reports of what the JCT estimated would happen after that.

The JCT discusses this on page 6 of its report.  It notes that due to the reversal of most of the individual income tax cuts (while leaving in place measures that would lead to higher individual income taxes), coupled with the rising interest rates resulting from the higher deficits (the $50 billion figure discussed above, but growing over time), the impact on GDP by the end of the third decade of such measures would be partially or wholly offset.  The growth effects die out over time.  As a result, we will then be left with a higher federal debt, but GDP the same or similar, and hence a government debt burden that is then higher for our grandchildren than would be the case if this tax plan were never approved.

e)  And it is critically important to recognize that the JCT could only arrive at its estimates of what the impact would be on GDP via economic models.  They did recognize that any individual economic model has issues, and therefore they used three different ones.  The 0.8% increase in GDP forecast for 2027 was the weighted average outcome of those three, weighting them not equally, but rather by 40/40/20.  Each model approaches the issue differently.  And while the JCT report is honest on what they did, and did report on the numbers used for some of the key parameters in each of the models, one would have liked to see more.

To start, only the 0.8% figure was given, resulting from the weighted average of the individual model forecasts.  One would have liked to have seen what the individual model results were.  Were they all fairly close to the 0.8% figure (in which case one would take some comfort in the similar findings), or did the different models produce quite different forecasts?  If the latter, one can not place much confidence in the overall weighted average as providing a robust estimate.

But more fundamentally, one needs to recognize that these are forecasts produced by models.  The results the models will produce will depend on the model structure assumed (as set by the analyst), and on the specific values assumed for the key model parameters.  The fact that the JCT used three different models for this (and reasonably so) shows how unsettled such analysis is.  Different models can come up with completely different results, as different aspects of the economy will be emphasized by each modeler.

The fundamental problem is that it is difficult to impossible to be able to say from actual data observed what the best model might be.  The overall net effects on growth are just too small, and there is so much going on also with the economy that one cannot come up with robust estimates of the impacts of such changes in tax law.  It is important to recognize that changes in tax law can have expansionary effects in some areas (including not just in different sectors but also in different areas of economic behavior) and contractionary effects in others.  The overall impact will depend on the net impact of them all, and this can be small to non-existent as the individual effects can go in opposite directions.  Hence one does not see in the observed data on GDP any indication that such changes in tax law (as have occurred in the past) have led to higher (or lower) GDP.

This was discussed in a previous post on this blog with regard to the impact on labor supply (and hence output) from a change in individual income tax rates.  There are income effects as well as substitution effects, their impacts go in opposite directions, and the net impact may then be small or not there at all as they simply offset each other.  There is a similar problem with assessing the impact on investment from changes in the corporate income tax proposals.  While some would argue that a lower corporate income tax rate will spur investment, the proposal also to limit the deductibility of interest on borrowed funds will act to reduce the incentive to invest.  The weighted average cost of capital (after taxes) will be higher when interest is not deductible, and the decision to invest depends on the balance between the (after-tax) expected return on investment and the (after tax) weighted average cost of capital for the funds being invested.

The net impact on the economy is therefore an empirical question, and one cannot say from ex-ante theorizing alone what that net impact might be.  One can construct models based on different theories, but then the net impact will depend on the model structures assumed and the specific values chosen for the various parameters used.  These can be difficult to impossible to estimate independently.

Finally, any such models will only be able to focus on a few of the possible changes in tax law.  They will not have the granularity to assess properly the literally hundreds of changes in law that the Republican tax plan includes.  Depending on the success or not of different interest groups and their lobbyists, the Republican tax plan has special favors, or harms, for different groups, and no economic model can capture all of them.  The models used by the JCT are, of necessity, much broader.

D.  Conclusion

To conclude, the JCT report on the macro impacts from the Republican tax plan is important and valuable, but is typically being misinterpreted.  The increase in the federal debt resulting from the tax cuts will be significantly higher than what one obtains by a simple summation of the year by year revenue impacts, as those impacts do not take into account the interest that will need to be paid on the now higher federal debt.  Those additional interest payments will be significant, and the addition to the federal debt will be about a quarter higher by the end of ten years than what a simple sum of the year by year losses in tax revenue would come to.

The JCT also concluded that its best estimate of the impact on GDP of the tax plan after ten years was that GDP would be 0.8% higher.  This is not much – an increase in the growth rate of just 0.08% a year.  Furthermore, even this would die out by the end of the third decade, in the tax plan as proposed.  The nation would then end up with a higher debt, a GDP which is about the same, and hence a debt to GDP ratio which is higher.

But of necessity, the estimates of the impact on GDP from the tax plan are crude.  The JCT was required to come up with such an estimate, but the only way to do this is to assume some economic model applies.  There is no good basis for choosing one, so the JCT used three, and the 0.8% figure is a weighted average of what those three different models forecast.  It would have been nice to see what each of those three forecasts were, to see if they were broadly similar.

All one can reasonably conclude is that the net impact on GDP is likely to be small.  This is consistent with what we have seen historically.  Any impacts on GDP, positive or negative, from such tax law changes have been too small to see in the data.  And there is certainly no reason to believe that such changes in tax law will lead to such a strong response in growth that the tax cuts “will pay for themselves”.  This has never happened before, and the JCT results indicate it will not happen now.

An Analysis of the Trump Tax Plan: Not a Tax Reform, But Rather a Massive Tax Cut for the Rich

A.  Introduction

The Trump administration released on September 27 its proposed tax plan.  It was exceedingly skimpy (only nine pages long, including the title page, and with all the white space could have been presented on half that number of pages).  Importantly, it was explicitly vague on many of the measures, such as what tax loopholes would be closed to partially pay for the tax cuts (simply saying they would do this somehow).  One can, however, examine measures that were explicitly presented, and from these it is clear that this is primarily a plan for massive tax cuts for the rich.

It is also clear that this is not a tax reform.  A tax reform would be revenue neutral.  The measures proposed would not be.  And a reform would focus on changes in the structure of the tax system.  There is little of that here, but rather proposals to cut various tax rates (including in several cases to zero), primarily for the benefit of those who are well off.

One can see this in the way the tax plan was approached.  In a true tax reform, one would start by examining the system, and whether certain deductions and tax exemptions are not warranted by good policy (but rather serve only certain vested interests).  Closing such loopholes would lead to higher revenues being collected.  One would then determine what the new tax rates could be (i.e. by how much they could be cut) to leave the overall level of tax collection the same.

But that was not done here.  Rather, they start with specific proposals on what the new tax rates “should” be (12%, 25%, and 35% for individuals, and 20% for corporations), and then make only vague references to certain, unspecified, deductions and tax exemptions being eliminated or reduced, in order not to lose too much in revenues (they assert).  They have the process backward.

And it is clear that these tax cuts, should they be enacted by Congress, would massively increase the fiscal deficit.  While it is impossible to come up with a precise estimate of how much the tax plan would cost in lost revenues, due to the vagueness on the parameters and on a number of the proposals, Republicans have already factored into the long-term budget a reduction in tax revenues of $1.5 trillion over ten years.  And estimates of the net cost of the Trump plan range from a low of $2.2 trillion over ten years ($2.7 trillion when additional interest is counted, as it should be), to as high as $5 trillion over ten years.  No one can really say as yet, given the deliberate lack of detail.

But any of these figures on the cost are not small.  The total federal debt held by the public as of the end of September, 2017, was $14.7 trillion.  The cost in lost revenue could equal more than a third of this.  Yet Republicans in Congress blocked the fiscal expenditures we desperately needed in the years from 2010 onwards during the Obama years, when unemployment was still high, there was excess capacity in our underutilized factories, and the country needed to rebuild its infrastructure (as we still do).  The argument then was that we could not add to our national debt.  But now the same politicians see no problem with adding massively to that debt to cover tax cuts that will primarily benefit the rich.  The sheer hypocrisy is breath-taking.

Not surprisingly, Trump officials are saying that there will be no such cost due to a resulting spur to our economic growth.  Trump himself asserted that his tax plan would lead the economy to grow at a 6% pace.  No economist sees this as remotely plausible.  Even Trump’s economic aides, such as Gary Cohn who was principally responsible for the plan, are far more cautious and say only that the plan will lead to growth of “substantially over 3 percent”.  But even this has no basis in what has been observed historically after the Reagan and Bush tax cuts, nor what one would expect from elementary economic analysis.

The lack of specificity in many of the proposals in the tax plan issued on September 27 makes it impossible to assess it in full, as major elements are simply only alluded to.  For example, it says that a number of tax deductions (both personal and corporate) will be eliminated or reduced, but does not say which (other than that they propose to keep the deductions for home mortgage interest and for charity).  As another example, the plan says the number of personal income tax brackets would be reduced from seven currently to just three broad ones (at 12%, 25%, and 35%), but does not say at what income levels each would apply.  Specifics were simply left out.

For a tax plan where work has been intensively underway for already the eight months of this administration (and indeed from before, as campaign proposals were developed), such vagueness must be deliberate.  The possible reasons include:  1) That the specifics would be embarrassing, as they would make clear the political interests that would gain or lose under the plan; 2) That revealing the specifics would spark immediate opposition from those who would lose (or not gain as others would); 3) That revealing the specifics would make clear that they would not in fact suffice to achieve what the Trump administration is asserting (e.g. that ending certain tax deductions will make the plan progressive, or generate revenues sufficient to offset the tax rate cuts); and/or 4) That they really do not know what to do or what could be done to fix the issue.

One can, however, look at what is there, even if the overall plan is incomplete.  This blog post will do that.

B.  Personal Income Taxes

The proposals are (starting with those which are most clear):

a)  Elimination of the Estate Tax:  Only the rich pay this.  It only applies to estates given to heirs of $10.98 million or more (for a married couple).  This only affects the top 0.2%, most wealthy, households in the US.

b)  Elimination of the Alternative Minimum Tax:  This also only applies to those who are rich enough for it to apply and who benefit from a range of tax deductions and other benefits, who would otherwise pay little in tax.  It would be better to end such tax deductions and other special tax benefits that primarily help this group, thus making the Alternative Minimum Tax irrelevant, than to end it even though it had remained relevant.

c)  A reduction in the top income tax rate from 39.6% to 35%:  This is a clear gain to those whose income is so high that they would, under the current tax brackets, owe tax at a marginal rate of 39.6%.  But this bracket only kicks in for households with an adjusted gross income of $470,700 or more (in 2017).  This is very close to the minimum income of those in the top 1% of the income distribution ($465,626 in 2014), and the average household income of those in that very well-off group was $1,260,508 in 2014.  Thus this would be a benefit only to the top 1%, who on average earn over $1 million a year.

The Trump plan document does include a rather odd statement that the congressional tax-writing committees could consider adding an additional, higher, tax bracket, for the very rich, but it is not at all clear what this might be.  They do not say.  And since the tax legislation will be written by the congressional committees, who are free to include whatever they choose, this gratuitous comment is meaningless, and was presumably added purely for political reasons.

d)  A consolidation in the number of tax brackets from seven currently to just three, of 12%, 25%, and 35%:  Aside from the clear benefit to those now in the 39.6% bracket, noted above, one cannot say precisely what the impact the new tax brackets would have for the other groups since the income levels at which each would kick in was left unspecified.  It might have been embarrassing, or contentious, to do so.  But one can say that any such consolidation would lead to less progressivity in the tax system, as each of the new brackets would apply to a broader range of incomes.  Instead of the rates rising as incomes move up from one bracket to the next, there would now be a broader range at which they would be kept flat.  For example, suppose the Trump plan would be for the new 25% rate to span what is now taxed at 25% or 28%.  That range would then apply to household incomes (for married couples filing jointly, and in 2017) from $75,900 on the low end to $233,350 at the high end.  The low-end figure is just above the household income figure of $74,869 (in 2016) for those reaching the 60th percentile of the income distribution (see Table A-2 of this Census Bureau report), while the top-end is just above the $225,251 income figure for those reaching the 95th percentile.  A system is not terribly progressive when those in the middle class (at the 60th percentile) pay at the same rate as those who are quite well off (in the 95th percentile).

e)  A ceiling on the tax rate paid on personal income received through “pass-through” business entities of just 25%:  This would be one of the more regressive of the measures proposed in the Trump tax plan (as well as one especially beneficial to Trump himself).  Under current tax law, most US businesses (95% of them) are incorporated as business entities that do not pay taxes at the corporate level, but rather pass through their incomes to their owners or partners, who then pay tax on that income at their normal, personal, rates.  These so-called “pass-through” business entities include sole proprietorships, partnerships, Limited Liability Companies (LLCs), and sub-chapter S corporations (from the section in the tax code).  And they are important, not only in number but also in incomes generated:  In the aggregate, such pass-through business entities generate more in income than the traditional large corporations (formally C corporations) that most people refer to when saying corporation.  C corporations must pay a corporate income tax (to be discussed below), while pass-through entities avoid such taxes at the company level.

The Trump tax plan would cap the tax rate on such pass-through income at 25%.  This would not only create a new level of complexity (a new category of income on which a different tax is due), but would also only be of benefit to those who would otherwise owe taxes at a higher rate (the 35% bracket in the Trump plan).  If one were already in the 25% bracket, or a lower one, that ceiling would make no difference at all and would be of no benefit.  But for those rich enough to be in the higher bracket, the benefit would be huge.

Who would gain from this?  Anyone who could organize themselves as a pass-through entity (or could do so in agreement with their employer).  This would include independent consultants; other professionals such as lawyers, lobbyists, accountants, and financial advisors; financial entities and the partners investing in private-equity, venture-capital, and hedge funds; and real estate developers.  Trump would personally benefit as he owns or controls over 500 LLCs, according to Federal Election Commission filings.  And others could reorganize into such an entity when they have a tax incentive to do so.  For example, the basketball coach at the University of Kansas did this when Kansas created such a loophole for what would otherwise be due under its state income taxes.

f)  The tax cuts for middle-income groups would be small or non-existent:  While the Trump tax proposal, as published, repeatedly asserts that they would reduce taxes due by the middle class, there is little to suggest in the plan that that would be the case.  The primary benefit, they tout (and lead off with) is a proposal to almost double the standard deduction to $24,000 (for a married couple filing jointly).  That standard deduction is currently $12,700.  But the Trump plan would also eliminate the personal exemption, which is $4,050 per person in 2017.  Combining the standard deduction and personal exemptions, a family of four would have $28,900 of exempt income in 2017 under current law ($12,700 for the standard deduction, and personal exemptions of four times $4,050), but only $24,000 under the Trump plan.  They would not be better off, and indeed could be worse off.  The Trump plan is also proposing that the child tax credit (currently a maximum of $1,000 per child, and phased out at higher incomes) should be raised (both in amount, and at the incomes at which it is phased out), but no specifics are given so one cannot say whether this would be significant.

g)  Deduction for state and local taxes paid:  While not stated explicitly, the plan does imply that the deduction for state and local taxes paid would be eliminated.  It also has been much discussed publicly, so leaving out explicit mention was not an oversight.  What the Trump plan does say is the “most itemized deductions” would be eliminated, other than the deductions for home mortgage interest and for charity.

Eliminating the deduction for state and local taxes appears to be purely political.  It would adversely affect mostly those who live in states that vote for Democrats.  And it is odd to consider this tax deduction as a loophole.  One has to pay your taxes (including state and local taxes), or you go to jail.  It is not something you do voluntarily, in part to benefit from a tax deduction.  In contrast, a deduction such as for home mortgage interest is voluntary, one benefits directly from buying and owning a nice house, and such a deduction benefits more those who are able to buy a big and expensive home and who qualify for taking out a large mortgage.

h)  Importantly, there was much that was not mentioned:  One must also keep in mind what was not mentioned and hence would not be changed under the Trump proposals.  For example, no mention was made of the highly favorable tax rates on long-term capital gains (for assets held one year or more) of just 20%.  Those with a high level of wealth, i.e. the wealthy, gain greatly from this.  Nor was there any mention of such widely discussed loopholes as the “carried interest” exception (where certain investment fund managers are able to count their gains from the investment deals they work on as if it were capital gains, rather than a return on their work, as it would be for the lawyers and accountants on such deals), or the ability to be paid in stock options at the favorable capital gains rates.

C.  Corporate Income Taxes

More than the tax cuts enacted under Presidents Reagan and Bush, the Trump tax plan focuses on cuts to corporate income (profit) taxes.  Proposals include:

a)  A cut in the corporate income tax rate from the current 35% to just 20%:  This is a massive cut.  But it should also be recognized that the actual corporate income tax paid is far lower than the headline rate.  As noted in an earlier post on this blog, the actual average rate paid has been coming down for decades, and is now around 20%.  There are many, perfectly legal, ways to circumvent this tax.  But setting the rate now at 20% will not mean that taxes equal to 20% of corporate profits will be collected.  Rather, unless the mechanisms used to reduce corporate tax liability from the headline rate of 35% are addressed, those mechanisms will be used to reduce the new collections from the new 20% headline rate to something far less again.

b)  Allow 100% of investment expenses to be deducted from profits in the first year, while limiting “partially” interest expense on borrowing:  This provision, commonly referred to as full “expensing” of investment expenditures, would reduce taxable profits by whatever is spent on investment.  Investments are expected to last for a number of years, and under normal accounting the expense counted is not the full investment expenditure but rather only the estimated depreciation of that investment in the current year.  However, in recent decades an acceleration in what is allowed for depreciation has been allowed in the tax code in order to provide an additional incentive to invest.  The new proposal would bring that acceleration all the way to 100%, which as far as it can go.

This would provide an incentive to invest more, which is not a bad thing, although it still would also have the effect of reducing what would be collected in corporate income taxes.  It would have to be paid for somehow.  The Trump proposal would partially offset the cost of full expensing of investments by limiting “partially” the interest costs on borrowing that can be deducted as a cost when calculating taxable profits.  The interest cost of borrowing (on loans, or bonds, or whatever) is currently counted in full as an expense, just like any other expense of running the business.  How partial that limitation on interest expenses would be is not said.

But even if interest expenses were excluded in full from allowable business expenses, it is unlikely that this would come close to offsetting the reduction in tax revenues from allowing investment expenditures to be fully expensed.  As a simple example, suppose a firm would make an investment of $100, in an asset that would last 10 years (and with depreciation of 10% of the original cost each year).  For this investment, the firm would borrow $100, on which it pays interest at 5%.  Under the current tax system, the firm in the first year would deduct from its profits the depreciation expense of $10 (10% of $100) plus the interest cost of $5, for a total of $15.  Under the Trump plan, the firm would be able to count as an expense in the first year the full $100, but not the $5 of interest.  That is far better for the firm.  Of course, the situation would then be different in the second and subsequent years, as depreciation would no longer be counted (the investment was fully expensed in the first year), but it is always better to bring expenses forward.  And there likely will be further investments in subsequent years as well, keeping what counts as taxable profits low.

c)  Tax amnesty for profits held abroad:  US corporations hold an estimated $2.6 trillion in assets overseas, in part because overseas earnings are not subject to the corporate income tax until they are repatriated to the US.  Such a provision might have made sense decades ago, when information systems were more primitive, but does not anymore.  This provision in the US tax code creates the incentive to avoid current taxes by keeping such earnings overseas.  These earnings could come from regular operations such as to sell and service equipment for foreign customers, or from overseas production operations.  Or such earnings could be generated through aggressive tax schemes, such as from transferring patent and trademark rights to overseas jurisdictions in low-tax or no-tax jurisdictions such as the Cayman Islands.  But whichever way such profits are generated, the US tax system creates the incentive to hold them abroad by not taxing them until they are repatriated to the US.

This is an issue, and could be addressed directly by changing the law to make overseas earnings subject to tax in the year the earnings are generated.  The tax on what has been accumulated in the past could perhaps be spread out equally over some time period, to reduce the shock, such as say over five years.  The Trump plan would in fact start to do this, but only partially as the tax on such accumulated earnings would be set at some special (and unannounced) low rates.  All it says is that while both rates would be low, there would be a lower rate applied if the foreign earnings are held in “illiquid” assets than in liquid ones.  Precisely how this distinction would be defined and enforced is not stated.

This would in essence be a partial amnesty for capital earnings held abroad.  Companies that have held their profits abroad (to avoid US taxes) would be rewarded with a huge windfall from that special low tax rate (or rates), totalling in the hundreds of billions of dollars, with the precise gain on that $2.6 trillion held overseas dependant on how low the Trump plan would set the tax rates on those earnings.

It is not surprising that US corporations have acted this way.  There was an earlier partial amnesty, and it was reasonable for them to assume there would be future ones (as the Trump tax plan is indeed now proposing).  In one of the worst pieces of tax policy implemented in the George W. Bush administration, an amnesty approved in 2004 allowed US corporations with accumulated earnings abroad to repatriate that capital at a special, low, tax rate of just 5.25%.  It was not surprising that the corporations would assume this would happen again, and hence they had every incentive to keep earnings abroad whenever possible, leading directly to the $2.6 trillion now held abroad.

Furthermore, the argument was made that the 2004 amnesty would lead the firms to undertake additional investment in the US, with additional employment, using the repatriated funds.  But analyses undertaken later found no evidence that that happened.  Indeed, subsequent employment fell at the firms that repatriated accumulated overseas earnings.  Rather, the funds repatriated largely went to share repurchases and increased dividends.  This should not, however, have been surprising.  Firms will invest if they have what they see to be a profitable opportunity.  If they need funds, they can borrow, and such multinational corporations generally have no problem in doing so.  Indeed, they can use their accumulated overseas earnings as collateral on such loans (as Apple has done) to get especially low rates on such loans.  Yet the Trump administration asserts, with no evidence and indeed in contradiction to the earlier experience, that their proposed amnesty on earnings held abroad will this time lead to more investment and jobs by these firms in the US.

d)  Cut to zero corporate taxes on future overseas earnings:  The amnesty discussed above would apply to the current stock of accumulated earnings held by US corporations abroad.  Going forward, the Trump administration proposes that earnings of overseas subsidiaries (with ownership of as little as 10% in those firms) would be fully exempt from US taxes.  While it is true that there then would be no incentive to accumulate earnings abroad, the same would be the case if those earnings would simply be made subject to the same current year corporate income taxes as the US parent is liable for, and not taxable only when those earnings are repatriated.

It is also not at all clear to me how exempting these overseas earnings from any US taxes would lead to more investment and more jobs in the US.  Indeed, the incentive would appear to me to be the opposite.  If a plant is sited in the US and used to sell product in the US market or to export it to Europe or Asia, say, earnings from those operations would be subject to the regular US corporate income taxes (at a 20% rate in the Trump proposals).  However, if the plant is sited in Mexico, with the production then sold in the US market or exported from there to Europe or Asia, earnings from those operations would not be subject to any US tax.  Mexico might charge some tax, but if the firm can negotiate a good deal (much as firms from overseas have negotiated such deals with various states in the US to site their plants in those states), the Trump proposal would create an incentive to move investment and jobs to foreign locations.

D.  Conclusion

The Trump administration’s tax plan is extremely skimpy on the specifics.  As one commentator (Allan Sloan) noted, it looks like it was “written in a bar one evening over a batch of beers for a Tax 101 class rather than by serious people who spent weeks working with tax issues”.

It is, of course, still just a proposal.  The congressional committees will be the ones who will draft the specific law, and who will then of necessity fill in the details.  The final product could look quite different from what has been presented here.  But the Trump administration proposal has been worked out during many months of discussions with the key Republican leaders in the House and the Senate who will be involved.  Indeed, the plan has been presented in the media not always as the Trump administration plan, but rather the plan of the “Big Six”, where the Big Six is made up of House Speaker Paul Ryan, Senate Majority Leader Mitch McConnell, House Ways and Means Committee Chairman Kevin Brady, Senate Finance Committee Chairman Orrin Hatch, plus National Economic Council Director Gary Cohn and Treasury Secretary Steven Mnuchin of the Trump administration.  If this group is indeed fully behind it, then one can expect the final version to be voted on will be very similar to what was outlined here.

But skimpy as it is, one can say with some certainty that the tax plan:

a)  Will be expensive, with a ten-year cost in the trillions of dollars;

b)  Is not in fact a tax reform, but rather a set of very large tax cuts;

and c)  Overwhelmingly benefits the rich.

The Impact of the Reagan and Bush Tax Cuts: Not a Boost to Employment, nor to Growth, nor to the Fiscal Accounts

Private Employment Following Tax Law Changes

A.  Introduction

The belief that tax cuts will spur growth and new jobs, and indeed even lead to an improvement in the fiscal accounts, remains a firm part of Republican dogma.  The tax plans released by the main Republican presidential candidates this year all presume, for example, that a spectacular jump in growth will keep fiscal deficits from increasing, despite sharp cuts in tax rates.  And conversely, Republican dogma also holds that tax increases will kill growth and thus then lead to a worsening in the fiscal accounts.  The “evidence” cited for these beliefs is the supposed strong recovery of the economy in the 1980s under Reagan.

But the facts do not back this up.  There have been four major rounds of changes in the tax code since Reagan, and one can look at what happened after each.  While it is overly simplistic to assign all of what followed solely to the changes in tax rates, looking at what actually happened will at least allow us to examine the assertion underlying these claims that the Reagan tax cuts led to spectacular growth.

The four major changes in the tax code were the following.  While each of the laws made numerous changes in the tax code, I will focus here on the changes made in the highest marginal rate of tax on income.  The so-called “supply-siders” treat the highest marginal rate to be of fundamental importance since, under their view, this will determine whether individuals will make the effort to work or not, and by how much.  The four episodes were:

a)  The Reagan tax cuts signed into law in August 1981, which took effect starting in 1982. The highest marginal income tax rate was reduced from 70% before to 50% from 1982 onwards.  There was an additional round of tax cuts under a separate law passed in 1986, which brought this rate down further to 38.5% in 1987 and to 28% from 1988 onwards. While this could have been treated as a separate tax change episode, I have left this here as part of the Reagan legacy.  Under the Republican dogma, this should have led to an additional stimulant to growth.  We will see if that was the case.  There was also a more minor change under George H.W. Bush as part of a 1990 budget compromise, which brought the top rate partially back from 28.0% to 31.0% effective in 1991.  While famous as it went against Bush’s “read my lips” pledge, the change was relatively small.

b)  The tax rate increases in the first year of the Clinton presidency.  This was signed into law in August 1993, with the tax rate increases applying in that year.  The top marginal income tax rate was raised to 39.6%.

c)  The tax cuts in the George W. Bush presidency that brought the top rate down from 39.6% to 38.6% in 2002 and to 35.0% in 2003.  The initial law was signed in June 2001, and then an additional act passed in 2003 made further tax cuts and brought forward in time tax cuts being phased in under the 2001 law.

d)  The tax rate increases for those with very high incomes signed into law in December 2012, just after Obama was re-elected, that brought the marginal rate for the highest income earners back to 39.6%.

We therefore have four episodes to look at:  two of tax cuts and two of tax increases.  For each, I will trace what happened from when the tax law changes were signed up to the end of the administration responsible (treating Reagan and Bush I as one).  The questions to address are whether the tax cut episodes led to exceptionally good job growth and GDP growth, while the the tax increases led to exceptionally poor job and GDP growth. We will then look at what happened to the fiscal accounts.

B.  Jobs and GDP Growth Following the Changes in Tax Law

The chart at the top of this post shows what happened to private employment, by calendar quarter relative to a base = 100 for the quarter when the new law was signed. The data is from the Bureau of Labor Statistics (downloaded, for convenience, from FRED).  A chart using total employment would look almost exactly the same (but one could argue that government employment should be excluded as it is driven by other factors).

As the chart shows, private job growth was best following the Clinton and Obama tax increases, was worse under Reagan-Bush I, and abysmal under Bush II.  There is absolutely no indication that big tax cuts, such as those under Reagan and then Bush II, are good for job growth.  I would emphasize that one should not then jump to the conclusion that tax increases are therefore good for job growth.  That would be overly simplistic.  But what the chart does show is that the oft-stated claim by Republican pundits that the Reagan tax cuts were wonderful for job growth simply has no basis in fact.

How about the possible impact on GDP growth?  A similar chart shows (based on BEA data on the GDP accounts):

Real GDP Following Tax Law Changes

Once again, growth was best following the Clinton tax increases.  Under Reagan, GDP growth first fell following the tax cuts being signed into law (as the economy moved down into a recession, which by NBER dating began almost exactly as the Reagan tax cut law was being signed), and then recovered.  But the path never catches up with that followed during the Clinton years.  Indeed after a partial catch-up over the initial three years (12 calendar quarters), the GDP path began to fall steadily behind the pace enjoyed under Clinton.  Higher taxes under Clinton were clearly not a hindrance to growth.

The Bush II and Obama paths are quite similar, even though growth during these Obama years has had to go up against the strong headwinds of fiscal drag from government spending cuts.  Federal government spending on goods and services (from the GDP accounts, with the figures in real, inflation-adjusted, terms) rose at a 4.4% per annum pace during the eight years of the Bush II administration, and rose at a 5.6% rate during Bush’s first term.  Federal government spending since the late 2012 tax increases were signed under Obama have fallen, in contrast, at a 2.8% per annum rate.

There is therefore also no evidence here that tax cuts are especially good for growth and tax increases especially bad for growth.  If anything, the data points the other way.

C.  The Impact on the Fiscal Accounts

The argument of those favoring tax cuts goes beyond the assertion that they will be good for growth in jobs and in GDP.  Some indeed go so far as to assert that the resulting stimulus to growth will be so strong that tax revenues will actually rise as a result, since while the tax rates will be lower, they will be applied against resulting higher incomes and hence “pay for themselves”.  This would be nice, if true.  Something for nothing. Unfortunately, it is a fairy tale.

What happened to federal income taxes following the changes in the tax rates?  Using CBO data on the historical fiscal accounts:

Real Federal Income Tax Revenues Following Tax Law Changes

Federal income tax revenues (in real terms) either fell or at best stagnated following the Reagan and then the Bush II tax cuts.  The revenues rose following the Clinton and Obama tax increases.  The impact is clear.

While one would think this should be obvious, the supply-siders who continue to dominate Republican thinking on these issues assert the opposite has been the case (and would be, going forward).  Indeed, in what must be one of the worst economic forecasts ever made in recent decades by economists (and there have been many bad forecasts), analysts at the Center for Data Analysis at the conservative Heritage Foundation concluded in 2001 that the Bush II tax cuts would lead government to “effectively pay off the publicly held federal debt by FY 2010”.  Publicly held federal debt would fall below 5% of GDP by FY2011 they said, and could not go any lower as some federal debt is needed for purposes such as monetary operations.  But actual publicly held federal debt reached 66% of GDP that year.  That is not a small difference.

Higher tax revenues help then make it possible to bring down the fiscal deficit.  While the deficit will also depend on public spending, a higher revenue base, all else being equal, will lead to a lower deficit.

So what happened to the fiscal deficit following these four episodes of major tax rate changes?  (Note to reader:  A reduction in the fiscal deficit is shown as a positive change in the figure.)

Change in Fiscal Deficit Relative to Base Year Following Tax Law Changes

The deficit as a share of GDP was sharply reduced under Clinton and even more so under Obama.  Indeed, under Clinton the fiscal accounts moved from a deficit of 4.5% of GDP in FY1992 to a surplus of 2.3% of GDP in FY2000, an improvement of close to 7% points of GDP.  And in the period since the tax increases under Obama, the deficit has been reduced by over 4% points of GDP, in just three years.  This has been a very rapid base, faster than that seen even during the Clinton years.  Indeed, the pace of fiscal deficit reduction has been too fast, a consequence of the federal government spending cuts discussed above.  This fiscal drag held back the pace of recovery from the downturn Obama inherited in 2009, but at least the economy has recovered.

In contrast, the fiscal deficit deteriorated sharply following the Reagan tax cuts, and got especially worse following the Bush II tax cuts.  The federal fiscal deficit was 2.5% of GDP in FY1981, when Reagan took office, went as high as 5.9% of GDP in FY1983, and was 4.5% of GDP in FY1992, the last year of Bush I (it was 2.5% of GDP in FY2015 under Obama).  Bush II inherited the Clinton surplus when he took office, but brought this down quickly (on a path initially similar to that seen under Reagan).  The deficit was then 3.1% of GDP in FY2008, the last full year when Bush II was in office, and hit 9.8% of GDP in FY2009 due largely to the collapsing economy (with Bush II in office for the first third of this fiscal year).

Republicans continue to complain of high fiscal deficits under the Democrats.  But the deficits were cut sharply under the Democrats, moving all the way to a substantial surplus under Clinton.  And the FY2015 deficit of 2.5% of GDP under Obama is not only far below the 9.8% deficit of FY2009, the year he took office, but is indeed lower than the deficit was in any year under Reagan and Bush I.  The tax increases signed into law by Clinton and Obama certainly helped this to be achieved.

D.  Conclusion

The still widespread belief among Republicans that tax cuts will spur growth in jobs and in GDP is simply not borne out be the facts.  Growth was better following the tax increases of recent decades than it was following the tax cuts.

I would not conclude from this, however, that tax increases are therefore necessarily good for growth.  The truth is that tax changes such as those examined here simply will not have much of an impact in one direction or the other on jobs and output, especially when a period of several years is considered.  Job and output growth largely depends on other factors.  Changes in marginal income tax rates simply will not matter much if at all. Economic performance was much better under the Clinton and Obama administrations not because they raised income taxes (even though they did), but because these administrations managed better a whole host of factors affecting the economy than was done under Reagan, Bush I, or Bush II.

Where the income tax rates do matter is in how much is collected in income taxes.  When tax rates are raised, more is collected, and when tax rates are cut, less is collected.  This, along with the management of other factors, then led to sharp reductions in the fiscal deficit under Clinton and Obama (and indeed to a significant surplus by the end of the Clinton administration), while fiscal deficits increased under Reagan, Bush I, and Bush II.

Higher tax collections when tax rates go up and lower collections when they go down should not be a surprising finding.  Indeed, it should be obvious.  Yet one still sees, for example in the tax plans issued by the Republican presidential candidates this year, reliance on the belief that a miraculous jump in growth will keep deficits from growing.

There is no evidence that such miracles happen.