The Obama Bull Market Rally in Equity Prices: One of the Biggest of the Last Seven Decades

Bull Markets, 1940-2013

 Bull Market Rallies Since 1940
  Ranked by overall growth in real terms
    Nominal % Real % Real Rate
Start Date End Date Change Change of Growth
Dec 4, 1987 Mar 24, 2000 582% 361% 13%
Jun 13, 1949 Aug 2, 1956 267% 222% 18%
Aug 12, 1982 Aug 25, 1987 229% 181% 23%
Apr 28, 1942 May 29, 1946 158% 124% 22%
Mar 9, 2009 Mar 15, 2013 131% 112% 21%
Oct 22, 1957 Dec 12, 1961 86% 76% 15%
Oct 9, 2002 Oct 9, 2007 101% 75% 12%
Jun 26, 1962 Feb 9, 1966 80% 69% 16%
May 26, 1970 Jan 11, 1973 74% 57% 19%
Oct 6, 1966 Nov 29, 1968 48% 37% 16%
Oct 3, 1974 Nov 28, 1980 126% 34% 5%
 

Obama has been called a socialist by his conservative critics.  He has been deemed anti-business and anti-private profit.  Were this the case, business would be suffering and equity prices would be depressed.  Yet corporate profits are now at record highs.  This was shown and discussed in an earlier post on this blog.  More recent figures are following the same upward trend, and are available in the National Income and Product Accounts produced by the BEA of the US Department of Commerce.

With profits at record highs, it will be a surprise only to those conservative critics that the stock market has been booming under Obama.  But what few might realize is the extent of the rally under Obama.  The current stock market rally is already the fifth largest of any stock market rally since 1940.  It is also still underway, while the others of course are not, so it may well move up in rank.

The chart and table above show the numbers.  The underlying figures were compiled by Merrill Lynch, and are available at the financial blog of Barry Ritholtz (the Merrill Lynch study itself appears to be available only privately to its clients, like much of the research of such brokerages).  For the numbers above I determined also the figures controlling for inflation (the originals were only in nominal terms), using the monthly CPI for the inflation index (from the BLS via FRED), and then ranked the rallies by the total returns in real terms.  I also updated the figures on the current rally to the numbers at market close on March 15.  The rallies shown are all those since 1940 (a total of 11) in which there was at least a 25% gain in nominal terms, which ended with a fall (a “correction”, as investors like to say) of at least 20%.

As noted, the Obama rally currently ranks number five on this list.  It began on March 9, 2009 (only six weeks from Obama’s inauguration on January 20), and as of Friday, March 15, 2013, the S&P 500 was 112% higher (in real terms) than where it was at the start.  Also noteworthy is the real rate of growth of 21% (at an annualized rate) over this four year period.  Of the 11 stock market rallies since 1940, this was the third fastest rate of growth, and only slightly below the rate of growth of the two faster rallies.

Depending on how long the current rally continues, the Obama bull market could well move up in rank.  While the market fell a bit on Friday as well as on Monday and was basically flat today (Tuesday), prior to that it had risen for 10 straight days.  This was the longest such daily streak since 1996.  While no one can predict what will happen to this rally, the increase achieved is already one for the records.

The assertions of the conservative critics that Obama is anti-business and has taken actions that suppress profits are therefore simply inconsistent with what the markets are telling us.  If this criticism of Obama had any basis, one would not be seeing such a rally in the markets.  Conservatives argue that the markets cannot be fooled, but here they are themselves ignoring what the markets are saying.

Of greater concern is not what has happened to profits, and share prices that reflected those profits, but rather what has happened to workers and their wages.  Unemployment is still high, at 7.7%.  While down from the peak of 10.0% reached in 2009 following the economic and financial collapse at the end of the Bush administration, a 7.7% unemployment rate is still well above the 5 to 6% rate one would see when the economy is at or close to full employment (there is always some unemployment, due to various frictions and mis-matches).  The recovery has been weak, and as has been discussed before in this blog, the weak recovery can be explained by the continued fiscal drag from cuts in government expenditures.

With the still high unemployment, it should not be surprising that workers have not had the power to bargain for substantial wage increases.  As was shown in the chart at the top of the recent post in this blog on the minimum wage, real compensation of workers has been flat to falling in recent years.  Yet as also seen in that chart, labor productivity has continued to rise.  With rising productivity but flat to falling wages, profits will rise.  Hence the economy has been good for profits and for a rising stock market.

The basic issue is that despite the assertions of the conservative critics that Obama has been fundamentally altering our economic structure, the truth is that Obama has not.  This is still an economy where wages have been depressed, rising well less than productivity growth since the 1980s.  Real average labor compensation (which includes both wages as well as compensation via benefits such as health insurance and pension plans) rose only by 35% between 1980 and 2012 (see the chart at the blog post cited above), for a growth rate of slightly below 1.0% a year.  But labor productivity grew by 86% over this period.  With productivity up, but wages almost flat, profits are far up.  And with profits mostly going to the already rich, the distribution of income has deteriorated sharply since Reagan was president.

Obama’s policies have not been bad for profits nor for the stock market.  The stock market rally is already one of the biggest since 1940, and is not yet over.  There is no evidence for the assertion that Obama has fundamentally changed the economic structure, to the detriment of business.  The problem, rather, is that Obama has not changed that structure.  As a result, and as has been the case since around 1980, labor has not been able to share fully in the gains from the growth in labor productivity.

The Stagnation Over the Last Half Century of the Real Minimum Wage Is Even Worse Than It Looks: But May Not Be Easy to Solve

Real Min Wage Under Alternative Scenarios, 1950-2012

A.  Introduction

The previous post on this blog looked at whether the periodic increases in the minimum wage since 1950 in the US had led to jumps in unemployment of those workers making the minimum wage.  It concluded that there was no evidence of higher unemployment resulting from the changes of the magnitude observed.  And this was found whether by simply examining what happened to unemployment in the months following those sporadic increases, or in more rigorous econometric studies that have been undertaken over the last two decades.

That blog post noted that despite those sporadic increases in the nominal minimum wage, the minimum wage in real, inflation adjusted, terms had still fallen significantly over the last half century.  The minimum wage, in terms of today’s prices, had averaged about $9 per hour over the 25 years 1956-80 inclusive, and had reached a peak of $10.82 in February 1968.  Yet the minimum wage is only $7.25 today.  President Obama proposed to Congress in his State of the Union address that the minimum wage be raised to $9.00.  This would be a modest goal, as it would bring it back only to a level of a half century ago.  During that half century, US per capita GDP has more than doubled.  Yet even that modest increase has been strongly criticized by Republican leaders and conservatives.

B.  Two Scenarios

Staying flat in real terms is an exceedingly limited goal.  One would expect growth in a growing economy.  And at $9.00 an hour, a full time worker (40 hours a week, 52 weeks a year with no vacation) would still be earning almost 20% less than the poverty line for a family of four.  It is therefore of interest to ask what would the minimum wage be today if it were not simply flat in real terms, but had grown along with the rest of the economy?

The graph above shows two scenarios.  One is where the minimum wage would have grown at the same pace as overall labor productivity growth, and the other is where the minimum wage would have grown at the same pace as real compensation has for all workers.

There are several points worth noting.  First, it is very interesting that over the period 1950 to 1968, one finds that labor productivity, real compensation of all workers, and (with more jumpiness) the real minimum wage, all tracked basically the same path.  This is as one would expect in a normal growing economy.  Productivity grows, real wages grow at a similar rate (implying that profits will also grow at a similar rate), and similar increases in the real minimum wage will not create difficulties.

But the trends then diverged.  The minimum wage, set by government policy, was not allowed to keep up with inflation, leading to a significant fall in real terms.  The deterioration in the real minimum wage was especially sharp and steady during the presidencies of Richard Nixon (1969-74), Reagan (1981-88, and carrying over into 1989) and George W. Bush (2001-2007).  By June 2007, the minimum wage had reached a low of $5.75 (in terms of today’s prices) – lower than at any other point in time since before 1950 (I did not look at earlier data than this).  The real minimum wage was $7.38 in January 1950, during the presidency of Harry Truman.  It was 22% less in 2007, 57 years later.

C.  The Divergence Since the 1980s Between Growth in Labor Productivity and Growth in Labor Compensation

Labor productivity and real compensation of all workers continued to track each other for a few years after 1968.  But then some divergence started to open up in the mid-1970s, and this divergence began to grow sharply from about 1982/83.  It has continued since.

This divergence between productivity growth and real compensation of workers since the 1980s has been noted and discussed before in this blog.  It was noted there that the changes that occurred during the Reagan presidency, while lauded by conservatives, in fact did not lead to overall faster growth in output or productivity (growth in output and in productivity have in fact been slower since the Reagan presidency than it was before).  But the changes that began during the Reagan term did lead to sharply slower growth in real wages, and led as well to a far worse distribution of income.  The rich, and especially the very rich (the top 1%, and even more so the top 0.1% and 0.01%) have done extremely well since 1980.  But as that blog post showed, the real incomes of the bottom 90% have grown only modestly (and almost solely in the second half of the 1990s, during Clinton’s term).

By 2012, the average real compensation of all workers was fully one-third less than what it would have been had it grown after 1968 at the same pace as labor productivity growth.  This is not a small difference.

The causes for this divergence between labor productivity growth and real compensation of workers, largely since 1982/83, are not all known.  Policy was clearly an important part of it.  One policy was that of allowing the minimum wage to fall in real terms, which pulled down the wages of not only those at the minimum wage, but also the wages of those some distance above the minimum wage as the minimum wage affects the whole lower end of the wage structure.  Reagan’s policies to undermine the ability of labor unions to bargain for higher wages were also a factor.  Government policies to keep down the wages of government workers would also have contributed.

But in addition to such policy factors, there were technological and other economic issues that probably contributed.  As Erik Brynjolfsson and Andrew McAfee argue in their recent book, Race Against the Machine, the high rate of change in computer and communications technology, and the accompanying growth in robotics, not only diminished the demand for many middle class jobs such on the automobile production lines, but also for middle class jobs such as accountants, clerks, and other skilled positions where rules are followed which a computer can be programmed to do.  This same technological change in computers and communications also enabled globalization of production.  And the changes made possible by the new technologies led to the development of more and more “winner-take-all” sectors, where a few winners at the top can supply the whole market, leaving little for the rest.

D.  Could the Minimum Wage be Raised to Match?

As the graph above shows, had the minimum wage continued to grow after 1968 at the same pace as overall labor productivity grew (as it had before 1968), it would have reached $24 an hour by 2012.  Had it grown even at the slower pace that overall compensation of workers had grown, it would have reached $16 an hour.  But I would not advocate increasing the minimum wage today to $24 an hour, or even $16 an hour.  While the previous blog post had noted that changes in the minimum wage of a magnitude seen in the past had not led to higher unemployment, I am not so sure this would hold if the current minimum wage ($7.25 an hour) were more than doubled or tripled.  Without more data, I would indeed be wary of a rise in the minimum wage to more than perhaps $11 or $12 an hour.

One possible approach might therefore be as follows.  To start, one would raise the minimum wage to $9.00 an hour now, as Obama has proposed.  Obama has then also proposed to index this rate to inflation, so that one does not again see the regression in real terms observed repeatedly in the past.  But this would be too modest.  One would raise the rate to $9.00 an hour now, then to $10 a year later, then to $11 a year after that, and so on.  At each step, one would observe what the effects are.  If the impact on employment of minimum wage workers is modest, one would continue.  At some point one would start to observe significant adverse impacts, and at that point one would stop or even move back a step.

The fact that raising the minimum wage to $24 an hour now, or even to $16 an hour, is considered unimaginable, and indeed would likely lead to significant adverse employment impacts, is telling.  Something fundamentally flawed has developed in the economy which the US did not see before the 1980s.  And it does such harm for the working poor that even a full time worker at the minimum wage will still earn well less than the poverty line income.  There is a clear need to understand this better, but that should not keep us from following a more active approach, such as the step by step process suggested above, until we do.

The Impact of Increasing the Minimum Wage on Unemployment: No Evidence of Harm

Minimum Wage vs. Unemployment Rates, 1950-Jan 2013

Minimum Wage vs. Ratio of Unemployment Rates, 1950-Jan 2013

A.  Introduction

In his State of the Union speech last month, President Obama called for a rise in the federal minimum wage from the current $7.25 per hour to a new rate of $9.00 per hour.  This would be a 24% increase, but would still mean that someone working full time, 40 hours per week, 52 weeks a year (no vacation), would earn only $18,720 a year.  Such a full time worker would still be earning well less than the current federal poverty line for a family of four of $23,050 per year.  The proposed increase is modest.

Republican leaders nonetheless immediately denounced the proposal, asserting that raising the minimum wage would hurt, not help, the poor, as they would lose their jobs.  They assert that instead of seeing an increase in their wage, the minimum wage workers would be fired.  And unlike in many other areas (such as the impact of fiscal policies) the Republican leadership here is making an argument that one would find in an introductory economics course.  Elementary economics would indeed argue that in perfectly competitive markets, an increase in the minimum wage would lead to such workers losing their jobs rather than being paid more.

B.  Have Increases in the Minimum Wage Led to Higher Unemployment of Such Workers in the Past?

But what is the evidence?  If increases in the minimum wage lead to such workers being fired, one would see higher unemployment among such workers very quickly in the months following each increase in the minimum wage in the past.  The graphs above show what in fact has happened.

The first graph shows the federal mandated minimum wage since 1950, in real inflation adjusted terms (using the CPI), plus the unemployment rates for all workers and separately for workers aged 16 to 24.  The data comes from the Bureau of Labor Statistics, but was downloaded for convenience from FRED, the Federal Reserve Economic Data web site maintained by the Federal Reserve Bank of St. Louis.  The unemployment rate for workers aged 16 to 24 is shown separately as one would expect that increases in the minimum wage would increase unemployment especially sharply in that group, if the assertion is correct that increases in the minimum wage lead to such workers losing their jobs.  Approximately 51% of the hourly wage workers earning the minimum wage are in this 16 to 24 age group.

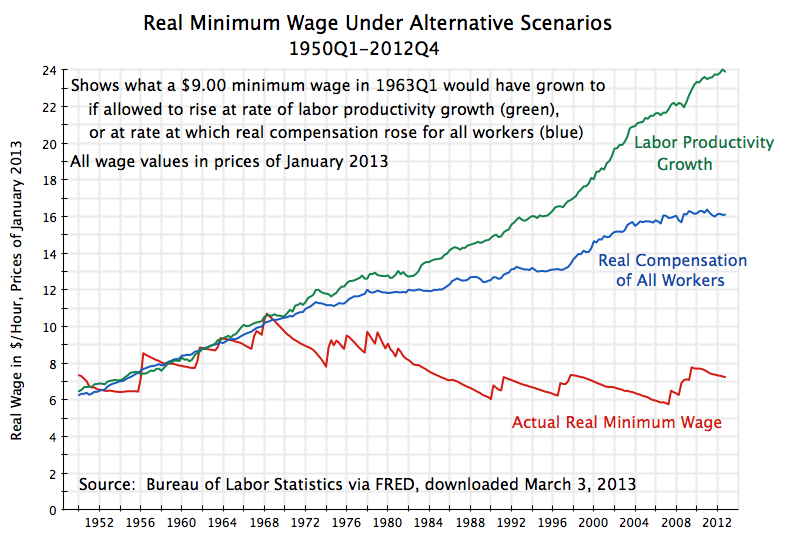
First of all, it is worth noting that the minimum wage, when adjusted to reflect general inflation, is a good deal lower now than a half century ago.  It reached a high (in prices of January 2013) of $10.82 in February 1968, and lows of $6.02 in March 1990 and $5.75 in June 2007.  It averaged close to $9.00 an hour over the twenty-five years of 1957-81 (inclusive), and is only $7.25 currently (almost 20% less).  The Obama proposal is modest, as he has only asked Congress to bring it back to that $9.00 an hour, the rate of a half century ago.

But does one see in the history that increases in the minimum wage lead to a jump in unemployment rates, particularly of the young (and decreases in the minimum wage leading to lower unemployment rates)?  Actually, no.  Unemployment rates do fluctuate a good deal, as they depend on macro conditions in the economy.  But it is hard to see any obvious jump in unemployment rates in the months following the sporadic increases in the real minimum wage we have had over the last more than 60 years.

It is also worth noting that due to the politics of the minimum wage, and the resistance of conservatives and businessmen to higher rates, increases in the minimum wage have been generally infrequent and then relatively large in percentage terms.  This thus provides good material for a test of whether increases in the minimum wage lead quickly to jumps in the unemployment rate (particularly of the young).  Yet one does not see it.

Any relationship might be hard to recognize in part because of the independent rises and falls in unemployment rates due to macro conditions.  The second graph therefore charts the real minimum wage along with a line that shows the ratio of the unemployment rate of those aged 16 to 24 to the unemployment rate for the entire labor force.  This ratio exploits the fact that a relatively high share (about 51%, as noted above) of minimum wage workers are young.  Thus, if it is in fact true that increases in the minimum wage will lead those making the minimum wage to become unemployed, the higher share of such workers in the ages 16 to 24 category will lead to an increase in that ratio.

But the graph does not show such a relationship.  While the real minimum wage has seen many sudden changes, the ratio of unemployment rates often does not then change, and in fact sometimes moves in a direction that is the opposite of what those opposed to increases in the minimum wage would predict.  The one possible exception appears to be a blip seen following the February 1968 increase in the minimum wage.  But this blip occurs in fact four months later (in June 1968; the time scale is compressed as the chart covers 63 years) and then drops back.  But one also sees that the steady decline in the real minimum wage during the 1980s in the Reagan years was accompanied by a rise in the ratio (the opposite of what they would predict), and that the ratio then declined (instead of rising) when the minimum wage was finally moved up in 1990 and 1991.  Similarly, increases in 2007-09 were accompanied by  a decline in the ratio.  One could pick out other examples, but basically what is shown is that there is no systematic pattern.

C.  More Rigorous Work on the Impact on Employment from Raising the Minimum Wage Also Shows No Harm

Graphs such as these are, however, simplistic.  While looking at the history is of interest, and should show at least some indication that increases in the minimum wage will lead to higher unemployment (especially of the young) if the minimum wage critics were correct, there is much more going on in the economy which should be taken into account.  Fortunately there have been rigorous studies that do this, and they too have found that the impact of increases in the minimum wage (of the magnitude historically seen) on unemployment rate is either non-existent or small.  Some studies have indeed found that increases in the minimum wage have reduced unemployment.

The seminal paper that launched the modern literature on the impact of the minimum wage was co-authored by economists David Card (of University of California, Berkeley) and Alan Krueger (then of Princeton, and now Chairman of the Council of Economic Advisors in the White House).  Card and Krueger controlled for extraneous effects that might be going on in the economy at the time a minimum wage is increased, by exploiting the fact that states may have separate minimum wage requirements from the federal requirements, and that states change their minimum wages at different times.  Specifically, they looked at employment in fast food establishments along the border between New Jersey and Pennsylvania on an occasion when New Jersey raised its minimum wage while there was no change in Pennsylvania.  They found no negative employment impact from New Jersey’s action.  Indeed, there might have been a small positive impact on employment following the increase in New Jersey’s minimum wage.

The Card and Krueger study, while rigorous, was limited as it looked at only one instance of a change in the minimum wage, and the impact on only one industry.  But more recent studies, following a similar approach, have extended the Card-Krueger work to many more cases.  A particularly comprehensive recent example is a paper by the economists Arindrajit Dube, William Lester, and Michael Reich.  Like Card-Krueger, they too found that increases in the minimum wage that have been periodically enacted in the US at the state level have not had a negative impact on employment of minimum wage workers.  And since changes at the state level would presumably have a bigger impact than changes at the national level (as jobs could in principle shift across state lines), there is no reason to believe the impact of a federally mandated change would be negative.

There is of course much more work on this issue, and a paper by John Schmitt issued last month provides a good summary of where the literature stands.  Less technical reviews of the issues and what economists have found are available here and here.  There are, of course, economists who would disagree, but the preponderance of the work done so far has found little or no evidence that increases in the minimum wage that we have seen in the past have led to decreases in employment of such workers.  Indeed, some studies have found that increases in the minimum wage increases employment.

D.  Why Does Standard Economic Theory Get This Wrong?

The real world evidence matters more than the theory.  But why would standard elementary economic theory appear to have gotten this wrong?  The truth is that there are many matters in the real world that do not behave as one might predict based purely on an economic abstraction.  Unemployment exists, for example, even though economic theory would predict that in a world of perfect competition, with full information and no transactions costs, and many other conditions, we should only see full employment.   But the assumptions of abstract economic models might well not apply in critically important ways once one faces the specifics of a particular issue.  That is why real world testing is important, as well as examination of the underlying assumptions and abstractions.

In the case of employment of workers at or close to the minimum wage, there are many reasons why the predictions of pure economic theory might well not apply.  Such labor markets are far from the perfect competition ideal.  There is a different balance of bargaining and other power between the employer and the potential minimum wage employee; the information available to each side of the transaction (on how productive the worker might be, and what his or her alternatives are) will differ; workers once they are in a job gain a good amount of job specific knowledge and abilities (not only on how to do the specific job, but also how best to work in a team with the specific colleagues there, where things are kept, and a million other details); that due to such job specific knowledge and imperfect information on who else might be available in the market, there will be substantial transactions costs incurred when an employee quits a job or is fired and a new one must be hired; and more.  Standard theory predicts that workers (in a perfect market) will be paid the value of their marginal product, but it can be difficult even to know what the marginal product of a specific worker might be when they work, as they typically do, in a team with others.  And one finds in the real world that wages are typically paid according to seniority and according to some hierarchy, rather than according to some strictly measured marginal productivity.

Good economists are therefore not surprised that markets in the real world can act quite differently from how the simple models might predict.  And they therefore accept as quite possible the finding of the real world empirical studies that increases in the minimum wage, such as those observed in the past, might well not have led to jumps in unemployment of workers earning the minimum wage.

E.  Conclusion

Full time workers in minimum wage jobs are poor, despite their evident willingness to work.  Even if the minimum wage is raised to $9.00 an hour from the current $7.25 an hour, as Obama has proposed, these working poor will still be earning well less than poverty line income.  And bringing the minimum wage to $9.00 an hour will only bring it back to where it was more than a half century ago.  Real GDP per capita has more than doubled over this period.  Yet minimum wage workers are currently earning 20% less.

Rigorous empirical studies do not show that increasing the minimum wage by an amount such as this will lead to an increase in unemployment of such workers.  Nor does one see such an increase in unemployment in a more casual examination of the evidence, such as in the graphs above.  While the poor need more assistance than just from this, increasing the minimum wage as Obama has proposed would certainly be an important help.