Inflation Other Than For Shelter Has Moderated – And Shelter is Special

The Bureau of Labor Statistics released its regular monthly report on the Consumer Price Index today, with data through April 2023.  Most news reports focused – understandably – on the twelve-month change in the overall CPI as well as of the core CPI (the CPI excluding the food and energy components, as the prices of food and energy are volatile and go down as well as up).  But in looking through the figures, I came across an interesting aspect that I have not seen discussed.

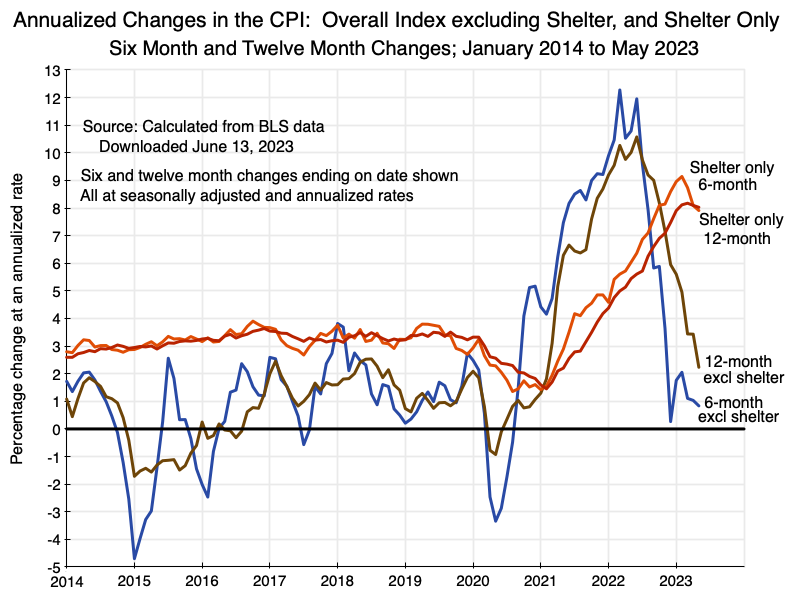
Specifically, while the overall CPI index has been declining slowly (the 12-month rate ending in April was 4.9% overall – down from a peak of 8.9% in June 2022), this was mostly due to the shelter portion of the CPI.  If one excludes the shelter component of the CPI, the most recent 12-month rate was 3.4% (down from 10.6% in June 2022 – see the chart above).  Furthermore and of greater interest, the 6-month rates for the CPI excluding shelter have fluctuated between essentially zero and 2.0% since December 2022.  This has been not just a one month fluctuation:  The 6-month changes have been at annualized rates of 2.0% or less for five months now.  And the Fed’s target for inflation is 2%.

The shelter component of the CPI, in contrast, has been steadily going up (until recently) since early 2021.  It is special for a number of reasons.  One is that it is the single most important component of the CPI, with a 35% weight in the index.  In comparison, food accounts for 13% and all energy for 7%.  Second, and importantly, estimating price changes to enter into the CPI for shelter is difficult.  As explained in detail in this factsheet from the BLS, the cost of shelter that enters into the determination of a consumer price index is not (as many mistakenly assume) the cost of buying a home.  Buying a home is an investment.  Rather, what enters into the cost-of-living index is the rental equivalent cost of living there.  The BLS imputes this rental equivalent cost by gathering data on the rents in fact being charged in that geographic area, and then adjusts these to take into account differences in quality and in payments made for associated services (such as for utilities, where payments to utilities are accounted for in a different area of the CPI).

A third and very important aspect of rents (and hence the rental equivalent for owner-occupied homes) is that rents change only periodically – usually annually.  Hence when the BLS surveys what rents are being charged in some geographic zone, the rents they will record will include households whose rents have been constant for close to a year as well as some households whose rents had recently stepped up but which will now be constant for a year.  Suppose, for example, that due to pressure in the markets, rents in some area are all being raised by 12%.  This will then lead to actual changes in the rents being paid month by month as the rental contracts come up for renewal.  With the renewals more or less evenly spread over the course of a year, in the first month roughly one-twelfth of the households will see their rents rise by 12%, but the rents for the other households will remain unchanged.  Hence the overall rise in rents, as then recorded in the CPI (and reflected as well in the rental equivalent cost in owner-occupied homes) will be just 1% in the first month.  In the second month it will rise to 2% (i.e. two-twelfths of the households will be paying 12% more and ten-twelfths will still be paying the same as before), and so on until after 12 months – and only after 12 months – the increase in rents being paid by everyone in the area will be the full 12%.

Thus the shelter component of the CPI – reflecting what people are actually paying in rents (and hence also what rent is imputed to owner-occupied homes) – changes only slowly over time.  This is seen in the chart at the top of this post, and not only with the recent increases since 2021 but also in the far more steady rates seen in the years before when compared to changes in the CPI excluding shelter.  (And note that in the period of 2014 to 2020 the increases in the cost of shelter were around 3 to 4% a year, or well above the prices in the CPI excluding the shelter component:  Housing was becoming steadily more expensive compared to other items in the CPI.)

The cost of shelter then started to rise, as noted above, from early 2021.  And in terms of the 12-month rate, it has risen steadily until very recently, where it has leveled off for three months now at about 8.1%.  But there are signs that it will soon start to come down (i.e. not increase as fast).  Not only has it leveled off, but the 6-month rate (annualized) has come down from 9.0% as of January to 8.1% now.  The 3-month rate is now 7.2%, the 2-month rate is 6.0%, and the 1-month rate is 5.2% (all annualized).

This suggests that the pace of inflation in shelter costs will be declining. There will certainly be bumps up and down, and given how rents are determined, the process will be a slow one.  It built up over a two-year period (from early 2021 to early 2023) and might well take a similar period of time to come down.  There will also certainly be ups and downs in what will happen to other prices in the CPI, especially for food and energy.

But for several months now, what has been driving the CPI above the Fed target of 2% has solely been the cost of shelter.  With increases in the cost of shelter now moderating, while the non-shelter components of the CPI are already at the rates seen prior to 2020, what we are now seeing in the rates for the overall CPI basically reflect the time lags that result from long-term rental contracts.

A Key Index of Inflation in the US Has Come Down

There are signs that inflation is coming down.  While still early and preliminary, recent monthly figures for the inflation indices that many economists (and Federal Reserve Board members) focus on, suggest a break from the inflation rates seen earlier in 2022.

On January 27, the Bureau of Economic Analysis (BEA) released its most recent monthly report on Personal Income and Outlays, with estimates for December 2022.  The figures are part of the National Income and Product Accounts (or NIPA, often referred to as the GDP accounts) that the BEA is responsible for.  The accounts include estimates for Personal Consumption Expenditures (PCE), and to put those into real terms the BEA also estimates the price indices that apply to those expenditures.  Items are weighted as they are for the Personal Consumption component of the GDP accounts.

The prices shown are all seasonally adjusted and at annual rates.  There is a great deal of volatility in the month-to-month figures, so it is best to focus on the trends over several months.  Many commentators focus on the year-on-year figures (a 12-month moving average), and these are shown as the red line in the charts.  But a 12-month period is long, and one does not know if changes observed are due to recent events or to events of close to a year ago.  For this reason, I prefer the shorter 3-month moving average figures (in blue).  As one can see, major changes in the 3-month figures will often give a good indication of where the 12-month figures will soon go.

The first chart at the top of this post shows values for the overall rate of inflation (where all personal consumption expenditures are included), while the second chart shows the values for core inflation (where food and energy items are excluded).  Core inflation is a better indicator of inflationary pressures, as food and energy costs are largely commodity items with prices that go down as well as up.  Their fluctuations are often wide.  Other prices are typically more “sticky”, and hence the core inflation index that excludes the volatile food and energy components serves as a better indicator of the trends.

Three-month core inflation rates have come down from around an average of about 5% (remember that all figures are at annual rates) during most of 2021 and 2022, to 3.6% in the 3-month period ending in November and then 2.9% in the period ending in December.  The overall PCE inflation rate fell earlier, from a higher level, and by more.  It was generally between 7 and 7 1/2% from late 2021 to June 2022 (and hit 8.6% in the 3-month period ending in March), but then fell to a range of between 2 and 4% since September.  In the three months ending in December, it was just 2.1%.  Interestingly, the 6-month change for the second half of 2022 was also 2.1% (at an annual rate).

Energy prices are a major part of this.  While the core inflation rate removes energy items from the basket of items included in the inflation index (along with food), those energy items will be those directly purchased by households.  That is, the core inflation index removes items such as gasoline purchased for your car or natural gas to heat your home.  But energy prices will also affect other prices indirectly – for example from the cost of fueling the trucks that bring items to the markets.  Based on the index of energy prices used in the computation of the overall PCE inflation index, energy prices rose sharply in March 2022, following Russia’s invasion of Ukraine in late February.  But the energy price index reached a peak in June 2022 and has since fallen almost to where it was in February 2022, just prior to the invasion.  Whether it will fall further is not known, but a further major fall from where it was in December is probably not likely anytime soon.  In this case, the inflation indices may not fall much further in the coming months, and may well bounce back up a percentage point or so.  But the trend is likely still downwards.

As noted before, these figures are still early.  One should expect fluctuations going forward, as there have been in the past.  And inflation in the next few months may well be higher than in the last few.  But the figures do suggest that inflation has come down, and has come down despite still very tight labor markets.  The unemployment rate was 3.5% in December – matching the lowest it has been since 1969, more than a half-century ago.  And the labor market has been tight for some time.  Unemployment was in the range of just 3.5 to 3.7% from March onwards, which is about the range of month-to-month statistical uncertainty in the estimates.

Despite these figures on inflation, there have been at least some prominent economists arguing inflation will remain high for an extended period.  Ken Rogoff – a professor at Harvard and a former chief economist for the IMF – authored a major article for the recent November/December issue of Foreign Affairs titled “The Age of Inflation”.  In it he wrote:

the world may very well be entering an extended period in which elevated and volatile inflation is likely to be persistent, not in the double digits but significantly above two percent.

Nouriel Roubini (often nicknamed “Dr. Doom” for his frequent pessimism, but who correctly forecast the 2008 financial collapse) has argued similarly, saying that high inflation will be with us for a very long time.

There are, of course, also economists arguing the other side – arguing that inflation has been and will be coming down.  The most well-known is perhaps Paul Krugman.  Another would be Jason Furman, a professor at Harvard and previously a chair of the Council of Economic Advisors during Obama’s presidency.  While they had argued earlier, in 2021, that inflation would not rise as far as it did and for as long as it did following the massive Covid spending packages of both Trump and Biden (totaling $5.7 trillion in federal government spending, or a huge 12.8% of GDP of 2020 and 2021 together), they now recognize and acknowledge that mistake.  But it is important also not to err in the opposite direction.

We will see what develops.  But based on what inflation has been in recent months, it very much looks like there has been a break from earlier levels and that the trend is downwards.

Obama and Prices: The Markets Expect Inflation to Remain Low

US Treasury Bond Yields, TIPS, and Expected Inflation, Jan 2, 2003, to Aug 8, 2013

Conservative critics of Obama argue his policies will inevitably lead to high inflation.  A previous blog post on this site showed that in fact inflation during the four years of Obama’s first term had been the lowest over any presidential four year term going back a half century.  Low inflation during Obama’s first term cannot be denied.

The conservative critics respond that while inflation may have been low so far, it is inevitable that inflation will soon rise.  The blog post cited above provides links to several examples of what they have been saying.  But this assertion can be examined as well.  In particular, the financial markets (which the conservative critics generally take as reflecting a sound view on such matters, as the investment returns of such investors will depend on getting this right) can be used to see what at least the markets believe inflation will be going forward.

Since 1997 the US Treasury has been issuing bonds of varying maturities whose principal is indexed to the US CPI price index.  These bonds, known as TIPS (for Treasury Inflation-Protected Securities), provide a return which will be the same in real terms regardless of what inflation turns out to be.  The yields on such bonds can be compared to the yields on regular US Treasury bonds of similar maturity.  Such regular US Treasury bonds will pay interest and at the end return the principal in certain dollar amounts, with a value in real terms which will vary depending on what inflation turned out to be.

Inflation is normally positive, so the regular bonds will pay rates which are higher than the rates on TIPS bonds.  But whether the higher rates are worthwhile will depend on how high inflation turns out to be.  To illustrate with some simple numbers, suppose the rate on a 10-year regular US Treasury bond is 3% while the rate on a 10-year TIPS is 1%.  If inflation turns out to be 2%, the bonds will be equally valuable.  But if inflation turns out to be 3%, it would have been better to have invested in the TIPS.  The TIPS will still pay out a 1% real return, while the regular US Treasury will yield a real return of only 0% (a 3% nominal return, but with 3% inflation the real yield will be zero).  Alternatively, suppose inflation turns out to be 1%.  The real return on the regular US Treasury will be 2% (equal to 3% minus 1%), while the TIPS will still yield the contracted 1% real return.  In one believes inflation will be just 1% over this period until maturity, it would have been better to have invested in the regular bonds.

The investors will therefore need to determine what they expect inflation to be.  They will bid up the price of one of the bonds (and bid down the price of the other) if they believe inflation over the time to maturity of the bond, will be higher or lower than the current gap in the yields between the two.  Where the prices of the two bonds settle, and therefore what the gap in yields is between the two, therefore reflects what the financial markets as a whole believe will be the rate of CPI inflation over the period until the bonds mature.  Since real money is riding on this, the investors will take it seriously.

The graph above shows the yields on regular 10-year US Treasury bonds (in blue) and on 10-year TIPS (in green), for the period from January 2, 2003, to August 8, 2013.  The data comes from the official US Treasury web site (where the data presented there goes back to January 2, 2003).  The implied 10-year expected rate of inflation (in red) is then calculated based on the difference between the two yields.

As can be seen in the graph, the yields on the regular 10-year US Treasury bond varied a fair amount over the period, from generally between 4 and 5% during the Bush presidency, falling over time to below 2% for much of 2012, and then rising to about 2 1/2% recently.  The 10-year TIPS yield similarly varied from around 2% during the Bush years, to negative levels for 2012 and the first half of 2013, and rising to a still low but positive 1/2% recently (and most recently just 1/3%).

Despite such fluctuations in the yields of the regular 10-year bond and the 10-year TIPS, the implied expected inflation rate (the difference between the two yields) has been relatively constant, at about 2 1/2% during the Bush years and a similar but slightly lower rate (on average) during the Obama presidency.  The one exceptional period, which should be excluded, would be during the period of economic and financial collapse in the final months of the Bush presidency, after Lehman Brothers went bankrupt and the financial markets were in chaos.  The TIPS yields went up while the regular US Treasury bond yields fell sharply, leading to an implied expectation of inflation of close to zero.  But the figures under such chaotic conditions should not be taken as meaningful.  The chaotic markets then stabilized within a short period of Obama taking office in January 2009, with the rates then returning to more normal levels.

The financial markets, which the conservative critics of Obama normally place a good deal of faith in, therefore do not show any indication that they expect inflation over the next decade to rise.  Rather, they expect inflation of around 2% a year to continue, which is consistent also with the rate of inflation the Fed targets.

Finally, the figures on the bond yields in the graph above also show that the US government has been able to borrow, and continues to be able to borrow, at incredibly low rates, whether in real or nominal terms.   The TIPS yield (the borrowing rate in real terms) was indeed negative in for most of 2012 and the first half of 2013, and is still only 1/2% or less.  Even were it not for the still high unemployment in the country, this is the period when the government should be undertaking investments in both new infrastructure and other assets, and in maintenance of existing assets.  Such investments are worthwhile even if they generate returns of only 1/2% in real terms.  Yet such investments, particularly in maintenance, will generate returns that are orders of magnitude greater than that.

It has been incredibly stupid that the Republican insistence on cutting government spending has blocked us from proceeding with such investments at a time when the borrowing costs to fund them have been so low.