

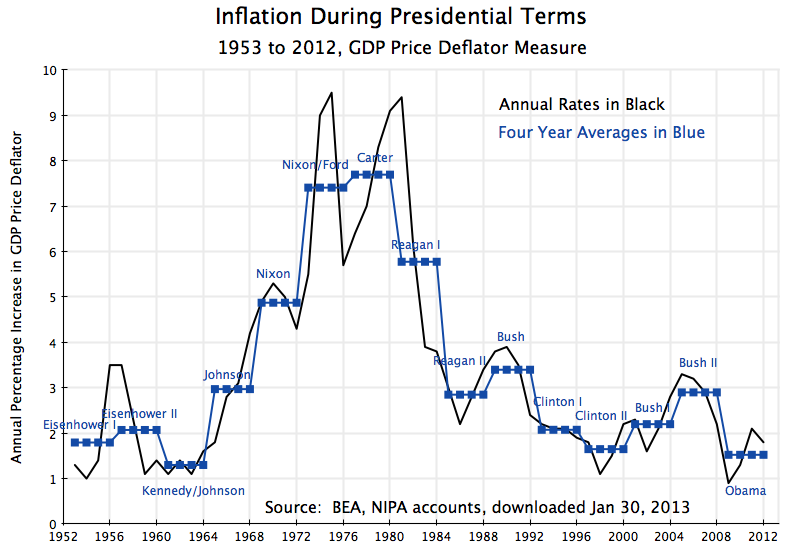
Conservative critics of Obama argue his policies will inevitably lead to high inflation. A previous blog post on this site showed that in fact inflation during the four years of Obama’s first term had been the lowest over any presidential four year term going back a half century. Low inflation during Obama’s first term cannot be denied.
The conservative critics respond that while inflation may have been low so far, it is inevitable that inflation will soon rise. The blog post cited above provides links to several examples of what they have been saying. But this assertion can be examined as well. In particular, the financial markets (which the conservative critics generally take as reflecting a sound view on such matters, as the investment returns of such investors will depend on getting this right) can be used to see what at least the markets believe inflation will be going forward.
Since 1997 the US Treasury has been issuing bonds of varying maturities whose principal is indexed to the US CPI price index. These bonds, known as TIPS (for Treasury Inflation-Protected Securities), provide a return which will be the same in real terms regardless of what inflation turns out to be. The yields on such bonds can be compared to the yields on regular US Treasury bonds of similar maturity. Such regular US Treasury bonds will pay interest and at the end return the principal in certain dollar amounts, with a value in real terms which will vary depending on what inflation turned out to be.
Inflation is normally positive, so the regular bonds will pay rates which are higher than the rates on TIPS bonds. But whether the higher rates are worthwhile will depend on how high inflation turns out to be. To illustrate with some simple numbers, suppose the rate on a 10-year regular US Treasury bond is 3% while the rate on a 10-year TIPS is 1%. If inflation turns out to be 2%, the bonds will be equally valuable. But if inflation turns out to be 3%, it would have been better to have invested in the TIPS. The TIPS will still pay out a 1% real return, while the regular US Treasury will yield a real return of only 0% (a 3% nominal return, but with 3% inflation the real yield will be zero). Alternatively, suppose inflation turns out to be 1%. The real return on the regular US Treasury will be 2% (equal to 3% minus 1%), while the TIPS will still yield the contracted 1% real return. In one believes inflation will be just 1% over this period until maturity, it would have been better to have invested in the regular bonds.
The investors will therefore need to determine what they expect inflation to be. They will bid up the price of one of the bonds (and bid down the price of the other) if they believe inflation over the time to maturity of the bond, will be higher or lower than the current gap in the yields between the two. Where the prices of the two bonds settle, and therefore what the gap in yields is between the two, therefore reflects what the financial markets as a whole believe will be the rate of CPI inflation over the period until the bonds mature. Since real money is riding on this, the investors will take it seriously.
The graph above shows the yields on regular 10-year US Treasury bonds (in blue) and on 10-year TIPS (in green), for the period from January 2, 2003, to August 8, 2013. The data comes from the official US Treasury web site (where the data presented there goes back to January 2, 2003). The implied 10-year expected rate of inflation (in red) is then calculated based on the difference between the two yields.
As can be seen in the graph, the yields on the regular 10-year US Treasury bond varied a fair amount over the period, from generally between 4 and 5% during the Bush presidency, falling over time to below 2% for much of 2012, and then rising to about 2 1/2% recently. The 10-year TIPS yield similarly varied from around 2% during the Bush years, to negative levels for 2012 and the first half of 2013, and rising to a still low but positive 1/2% recently (and most recently just 1/3%).
Despite such fluctuations in the yields of the regular 10-year bond and the 10-year TIPS, the implied expected inflation rate (the difference between the two yields) has been relatively constant, at about 2 1/2% during the Bush years and a similar but slightly lower rate (on average) during the Obama presidency. The one exceptional period, which should be excluded, would be during the period of economic and financial collapse in the final months of the Bush presidency, after Lehman Brothers went bankrupt and the financial markets were in chaos. The TIPS yields went up while the regular US Treasury bond yields fell sharply, leading to an implied expectation of inflation of close to zero. But the figures under such chaotic conditions should not be taken as meaningful. The chaotic markets then stabilized within a short period of Obama taking office in January 2009, with the rates then returning to more normal levels.
The financial markets, which the conservative critics of Obama normally place a good deal of faith in, therefore do not show any indication that they expect inflation over the next decade to rise. Rather, they expect inflation of around 2% a year to continue, which is consistent also with the rate of inflation the Fed targets.
Finally, the figures on the bond yields in the graph above also show that the US government has been able to borrow, and continues to be able to borrow, at incredibly low rates, whether in real or nominal terms. The TIPS yield (the borrowing rate in real terms) was indeed negative in for most of 2012 and the first half of 2013, and is still only 1/2% or less. Even were it not for the still high unemployment in the country, this is the period when the government should be undertaking investments in both new infrastructure and other assets, and in maintenance of existing assets. Such investments are worthwhile even if they generate returns of only 1/2% in real terms. Yet such investments, particularly in maintenance, will generate returns that are orders of magnitude greater than that.
It has been incredibly stupid that the Republican insistence on cutting government spending has blocked us from proceeding with such investments at a time when the borrowing costs to fund them have been so low.


You must be logged in to post a comment.