The Performance of the Stock Market During Trump’s Term in Office: Not So Special

A.  Introduction

Stock market performance is often taken to be a good measure of how the economy as a whole is performing.  But it is not.  For most Americans it is simply irrelevant, as the overwhelming share of investments in the stock markets are held by only a small segment of the population (the wealthy).  And its track record as a broader indicator of how the economy is performing is imperfect at best.

Still, many do focus on stock market returns, and Trump brags that the performance of the market during his term in office has been spectacular.

That is not the case.  This post will look at how the stock market has performed during Trump’s term in office thus far, and compare it to what that performance was under presidents going back to Reagan up to the same point in their terms.

First, however, we will briefly discuss to what extent one should expect stock market prices to reflect actions a president might be taking.  And the answer is some, but there is much more going on.

B.  Presidential Policies and the Stock Market

Owning shares of a firm entitles the owner to a share of the profits generated by that firm, both now and into the future.  And while there are many complications, a simple metric commonly used to assess the price of a share in a firm, is the price/earnings ratio.  If earnings (profits) go up, now and into the future, then for a given price/earnings ratio the price of the stock would go up in proportion.

Economic policies affect profits.  And in a thriving economy, profits will also be rising.  The policies of a presidential administration will affect this, and although the link is far from a tight one (with important lags as well), policies that are good for the economy as a whole will generally also lead to a rising stock market.

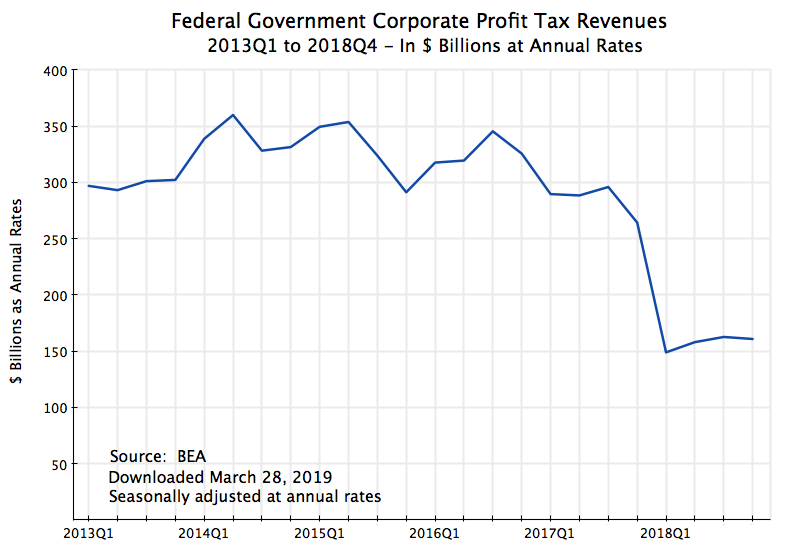
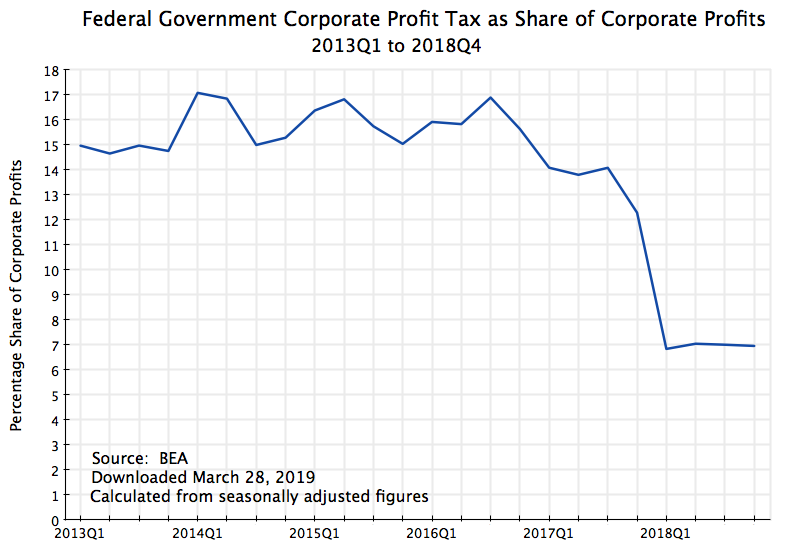
But there is also a more specific link to policy.  What accrues to the shareholders are not overall profits, but profits after taxes.  And this changed significantly as a result of the new tax law pushed through Congress by Trump and the Republicans in December 2017.  It resulted in the effective corporate profits (income) tax being cut by more than half:

This chart is an update of one prepared for an earlier post on this blog (where one can see a further discussion of what lies behind it).  It shows corporate profit taxes at the federal level as a share of corporate profits (calculated from figures in the national income accounts issued by the BEA).  While Trump and the Republicans in Congress asserted the 2017 tax bill would not lead to lower corporate profit taxes being paid (as loopholes would be closed, they asserted), in fact they did.  And dramatically so, with the effective corporate tax rate being slashed by more than half –  from around 15 to 16% prior to 2017, to just 7% or so since the beginning of 2018 (and to just 6.3% most recently).

This cut therefore led to a significant increase in after-tax profits for any given level of before-tax profits, which has accrued to the shareholders.  Note that this would not be due to the corporations becoming more productive or efficient, but rather simply from taxing profits less and shifting the tax burden then on to others (i.e. a redistributive effect).  And based on a reduction in the taxes from 16% of corporate profits to 7%, after-tax profits would have gone from 84% of profits to 93%, an increase of about 11%.  For any given price/earnings ratio, one would then expect stock prices, for this reason alone, to have gone up by about 11%.

[Side note:  Technically one should include in this calculation also the impact of taxes on profits by other government entities – primarily those of state and local governments.  These have been flat at around 3 1/2% of profits, on average.  With these taxes included, after-tax profits rose from 80 1/2% of before-tax profits to 89 1/2%, an increase that is still 11% within round-off.]

One should therefore expect that stock prices following this tax cut (or in anticipation of it) would have been bumped up by an additional 11% above what they otherwise would have been.  Other things equal, the performance of the stock market under Trump should have looked especially good as a result of the shift in taxes away from corporations onto others.  But what has in fact happened?

C.  Trump vs. Obama

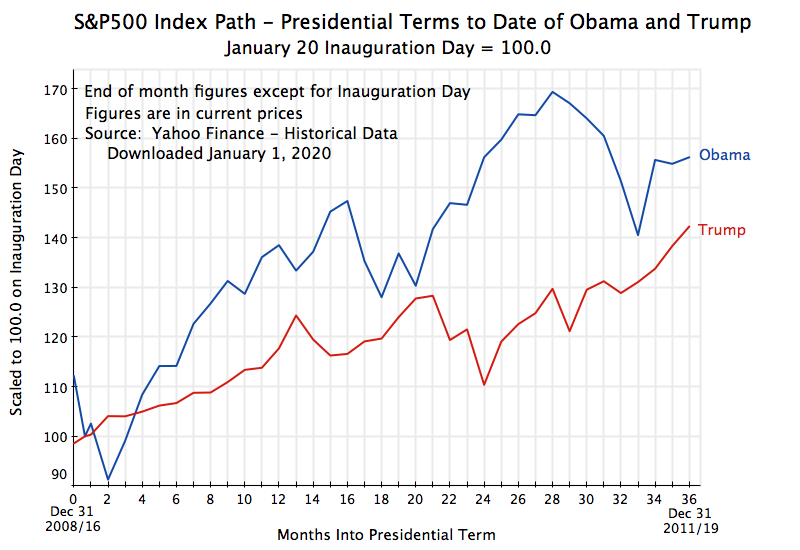
The chart at the top of this post compares the performance of the stock market during Trump’s term in office thus far (through December 31, 2019) to that under Obama to the same point in his first term in office.  The difference is clear.  Other than during Obama’s first few months in office, when he inherited from George W. Bush an economy in freefall, stock market performance under Obama was always better than it has been under Trump.  Even after slashing corporate profit taxes by more than half, the stock market under Trump did not do exceptionally well.

The S&P500 Index is being used as the measure of the US stock market.  Most professionals use this index as the best indicator of overall stock market performance, as it is comprehensive and broad (covering the 500 largest US companies as measured by stock market value, with the companies weighted in the index based on their market valuations).  The data were downloaded from Yahoo Finance, where it is conveniently available (with daily values for the index going back to 1927), but can be obtained from a number of sources.  The chart shows end-of-month figures, starting from December 31 of the month before inauguration, and going through to December 31 of their third year in office.  The index is scaled to 100.0 on exactly January 20 (with this presented as “month” 0.65).

So if one wants to claim “bragging rights” for which president saw a better stock market performance, Obama wins over Trump, at least so far in their respective terms.

D.  Trump vs. All Presidents Since Reagan

A comparison to just one president is limited.  How does the performance under Trump compare to that under other US presidents up to the same points in their terms in office?  Trump is roughly in the middle:

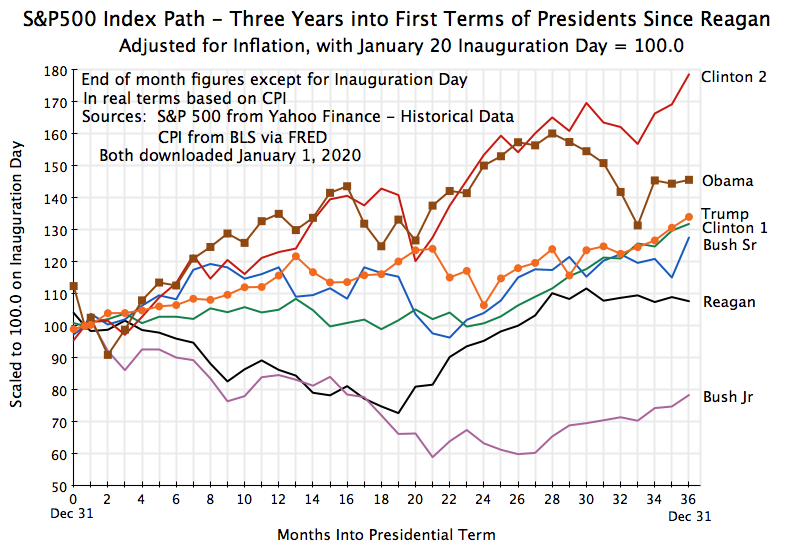
This chart tracks the performance under each president since Reagan up through the third year of their first terms in office.  I have adjusted here for inflation (using the CPI), as inflation was substantially higher during the Reagan and Bush Sr. terms in office than it has been since.  (I left the chart at the top of this post of just Obama vs. Trump in nominal terms as inflation in recent years has been steady and low.  But for those interested in the impact of this, one can see the Obama and Trump numbers in real terms in the current chart.)  I have included in this chart only the first terms of each president (with one exception) as the chart is already cluttered and was even more so when I had all the presidential terms.

The exception is that I included for perspective the stock market performance during Clinton’s second term in office.  The stock market rose over that period by close to 80% in real terms, which was substantially higher than under any other president since at least before Reagan in either their first or second terms.  The performance in Obama’s first term (of 146% in real terms) was the second-highest.  There was then a set of cases which, at the three-year mark, showed surprising uniformity in performance, with increases of between 32% and 34% in the second Reagan term, the first Clinton term, the second Obama term, and Trump’s term so far.  Bush Sr. was not far behind this set with an increase of 28%.

The worst performances were under Bush Jr. ( a fall of 22% to the third-year point in his first term), and Reagan (an increase of just 8% to that point in his first term).

So the performance of the market under Trump is in the middle – not the worst, but well below the best.

E.  Single Year Increases in the S&P500 from 1946 to 2019

Finally, was the increase under Trump in his best single year so far (2019) a record?  No, it was not.  Looking at the single year performances (in real terms) since 1946, the top 15 were:

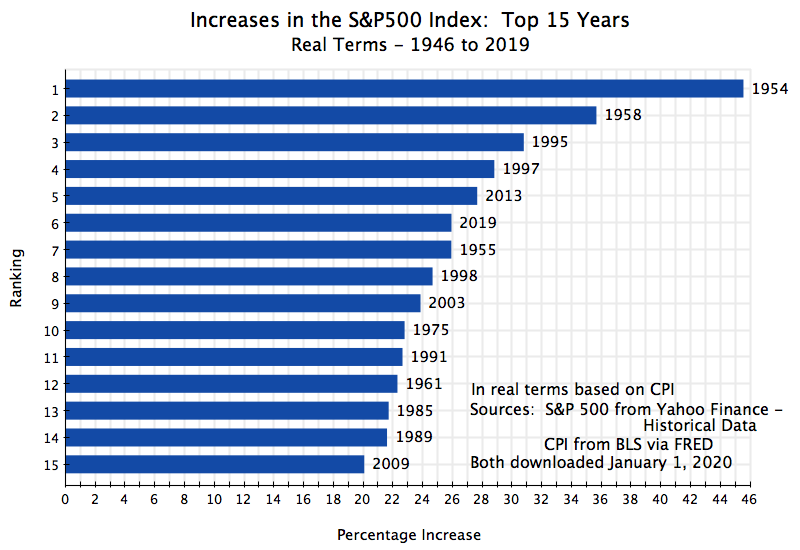
The increase in 2019, of 25.9%, was good, but only the sixth-highest of the 74 years between 1946 and 2019 (inclusive).  The stock market rose by more in 2013 during Obama’s term in office (by 27.7%), and in 1997 (28.8%) and 1995 (30.8%) which were both Clinton years.  And the highest increases were in 1958 (35.7%) and 1954 (45.6%) when Eisenhower was president.

The market also rose substantially in 2017, in Trump’s first year in office, by 16.9%.  But it then fell by 8.0% in 2018, in Trump’s second year in office.  Overall, the average rank (out of the 74 years from 1946 to 2019) of the individual year performances over the three years Trump has been in office so far, would place Trump in the middle third.  Not the worst, but also far from the best.  And comparing the three-year average while Trump has been president to rolling three-year averages since 1946, Trump’s average (of 11.6%) is well below the best.  The highest was an average return of 25.3% in 1995-97 during Clinton’s term in office.  And the three-year average return was also higher at 16.7% in 2012-14 during Obama’s term.

F.  Summary and Conclusion

Trump likes to brag that the performance of the stock market during his term in office has been exceptional.  But despite a slashing of corporate profit taxes (which, other things being equal would be expected to increase stock prices by 11%), the performance of the market during Trump’s term in office would put him in the middle.  Specifically:

a)  The market rose by more during the first three years of Obama’s term in office than it has under Trump;

b)  Compared to the first three years in office of all presidents since Reagan (whether first terms only, or first and second terms) would place Trump in the middle.  Indeed, the increase under Trump so far was almost exactly the same as the increases seen (at the three-year point) in Obama’s second term, in Reagan’s second term, and in Clinton’s first term.  And the return under Trump was well below that seen in Obama’s first term, and especially far below that in Clinton’s second term.

c)  The individual year performances during Trump’s three years have also not been exceptional.  While the performance in 2019 was good, it was below that of a number of other years since World War II, and below that of individual years during Obama’s and Clinton’s terms in office.

But as noted at the start of this post, stock market returns should not be over-emphasized.  An increase in the stock market does little for those who do not have the wealth to have substantial holdings in the stock market, and as a broader indicator of how the overall economy is performing, stock market returns are imperfect at best.

Still, one should be accurate in one’s claims.  And as on many things, Trump has not been.

Taxes on Corporate Profits Have Continued to Collapse


The Bureau of Economic Analysis (BEA) released earlier today its second estimate of GDP growth in the fourth quarter ot 2018.  (Confusingly, it was officially called the “third” estimate, but was only the second as what would have been the first, due in January, was never done due to Trump shutting down most agencies of the federal government in December and January due to his border wall dispute.)  Most public attention was rightly focussed on the downward revision in the estimate of real GDP growth in the fourth quarter, from a 2.6% annual rate estimated last month, to 2.2% now.  And current estimates are that growth in the first quarter of 2019 will be substantially less than that.

But there is much more in the BEA figures than just GDP growth.  The second report of the BEA also includes initial estimates of corporate profits and the taxes they pay (as well as much else).  The purpose of this note is to update an earlier post on this blog that examined what happened to corporate profit tax revenues following the Trump / GOP tax cuts of late 2017.  That earlier post was based on figures for just the first half of 2018.

We now have figures for the full year, and they confirm what had earlier been found – corporate profit tax revenues have indeed plummeted.  As seen in the chart at the top of this post, corporate profit taxes were in the range of only $150 to $160 billion (at annual rates) in the four quarters of 2018.  This was less than half the $300 to $350 billion range in the years before 2018.  And there is no sign that this collapse in revenues was due to special circumstances of one quarter or another.  We see it in all four quarters.

The collapse shows through even more clearly when one examines what they were as a share of corporate profits:


The rate fell from a range of generally 15 to 16%, and sometimes 17%, in the earlier years, to just 7.0% in 2018.  And it was an unusually steady rate of 7.0% throughout the year.  Note that under the Trump / GOP tax bill, the standard rate for corporate profit tax was cut from 35% previously to a new headline rate of 21%.  But the actual rate paid turned out (on average over all firms) to come to just 7.0%, or only one-third as much.  The tax bill proponents claimed that while the headline rate was being cut, they would close loopholes so the amount collected would not go down.  But instead loopholes were not only kept, but expanded, and revenues collected fell by more than half.

If the average corporate profit tax rate paid in 2018 had been not 7.0%, but rather at the rate it was on average over the three prior fiscal years (FY2015 to 2017) of 15.5%, an extra $192.2 billion in revenues would have been collected.

There was also a reduction in personal income taxes collected.  While the proportional fall was less, a much higher share of federal income taxes are now borne by individuals than by corporations.  (They were more evenly balanced decades ago, when the corporate profit tax rates were much higher – they reached over 50% in terms of the amount actually collected in the early 1950s.)  Federal personal income tax as a share of personal income was 9.2% in 2018, and again quite steady at that rate over each of the four quarters.  Over the three prior fiscal years of FY2015 to 2017, this rate averaged 9.6%.  Had it remained at that 9.6%, an extra $77.3 billion would have been collected in 2018.

The total reduction in tax revenues from these two sources in 2018 was therefore $270 billion.  While it is admittedly simplistic to extrapolate this out over ten years, if one nevertheless does (assuming, conservatively, real growth of 1% a year and price growth of 2%, for a total growth of about 3% a year), the total revenue loss would sum to $3.1 trillion.  And if one adds to this, as one should, the extra interest expense on what would now be a higher public debt (and assuming an average interest rate for government borrowing of 2.6%), the total loss grows to $3.5 trillion.

This is huge.  To give a sense of the magnitude, an earlier post on this blog found that revenues equal to the original forecast loss under the Trump / GOP tax plan (summing to $1.5 trillion over the next decade, and then continuing) would suffice to ensure the Social Security Trust Fund would be fully funded forever.  As things are now, if nothing is done the Trust Fund will run out in about 2034.  And Republicans insist that the gap is so large that nothing can be done, and that the system will have to crash unless retired seniors accept a sharp reduction in what are already low benefits.

But with losses under the Trump / GOP tax bill of $3.1 trillion over ten years, less than half of those losses would suffice to ensure Social Security could survive at contracted benefit levels.  One cannot argue that we can afford such a huge tax cut, but cannot afford what is needed to ensure Social Security remains solvent.

In the nearer term, the tax cuts have led to a large growth in the fiscal deficit.  Even the US Treasury itself is currently forecasting that the federal budget deficit will reach $1.1 trillion in FY2019 (5.2% of GDP), up from $779 billion in FY2018.  It is unprecedented to have such high fiscal deficits at a time of full employment, other than during World War II.  Proper fiscal management would call for something closer to a balanced budget, or even a surplus, in those periods when the economy is at full employment, while deficits should be expected (and indeed called for) during times of economic downturns, when unemployment is high.  But instead we are doing the opposite.  This will put the economy in a precarious position when the next economic downturn comes.  And eventually it will, as it always has.

The Fed is Not to Blame for the Falling Stock Market

Just a quick note on this Christmas Eve.  The US stock markets are falling.  The bull market that had started in March 2009, two months after Obama took office, and which then continued through to the end of Obama’s two terms, may be close to an end.  A bear market is commonly defined as one where the S&P500 index (a broad stock market index that most professionals use) has fallen by 20% or more from its previous peak.  As of the close of the markets this December 24, the S&P500 index is 19.8% below the peak it had reached on September 20.  The NASDAQ index is already in bear market territory, as it is 23.6% lower than its previous peak.  And the Dow Jones Industrial average is also close, at a fall of 18.8% from its previous peak.

Trump is blaming the Fed for this.  The Fed has indeed been raising interest rates, since 2015.  The Fed had kept interest rates at close to zero since the financial collapse in 2008 at the end of the Bush administration in order to spur a recovery.  And it had to keep interest rates low for an especially long time as fiscal policy turned from expansionary, in 2009/10, to contractionary, as the Republican Congress elected in 2010 forced through cuts in government spending even though employment had not yet then fully recovered.

Employment did eventually recover, so the Fed could start to bring interest rates back to more normal levels.  This began in late 2015 with an increase in the Fed’s target for the federal funds rate from the previous range of 0% to 0.25%, to a target range of 0.25% to 0.50%.  The federal funds rate is the rate at which banks borrow or lend federal funds (funds on deposit at the Fed) to each other, so that the banks can meet their deposit reserve requirements.  And the funds are borrowed and lent for literally just one night (even though the rates are quoted on an annualized basis).  The Fed manages this by buying and selling US Treasury bills on the open market (thus loosening or tightening liquidity), to keep the federal funds rate within the targeted range.

Since the 2015 increase, the Fed has steadily raised its target for the federal funds rate to the current range of 2.25% to 2.50%.  It raised the target range once in 2016, three times in 2017, and four times in 2018, always in increments of 0.25% points.  The market has never been surprised.  With unemployment having fallen to 5.0% in late 2015, and to just 3.7% now, this is exactly one would expect the Fed to do.

The path is shown in blue in the chart at the top of this post.  The path is for the top end of the target range for the rate, which is the figure most analysts focus on.  And the bottom end will always be 0.25% points below it.  The chart then shows in red the path for the S&P500 index.  For ease of comparison to the path for the federal funds rate, I have rescaled the S&P500 index to 1.0 for March 16, 2017 (the day the Fed raised the target federal funds rate to a ceiling of 1.0%), and then rescaled around that March 16, 2017, value to roughly follow the path of the federal funds rate.  (The underlying data were all drawn from FRED, the economic database maintained by the Federal Reserve Bank of St. Louis.  The data points are daily, for each day the markets were open, and the S&P 500 is as of the daily market close.)

Those paths were roughly similar up to September 2018, and only then did they diverge.  That is, the Fed has been raising interest rates for several years now, and the stock market was also steadily rising.  Increases in the federal funds rate by the Fed in those years did not cause the stock market to fall.  It is disingenuous to claim that it has now.

Why is the stock market now falling then?  While only fools claim to know with certainty what the stock market will do, or why it has moved as it has, Trump’s claim that it is all the Fed’s fault has no basis.  The Fed has been raising interest rates since 2015.  Rather, Trump should be looking at his own administration, capped over the last few days with the stunning incompetence of his Treasury Secretary, Steven Mnuchin.  With a perceived need to “do something” (probably at Trump’s instigation), Mnuchin made a big show of calling on Sunday the heads of the six largest US banks asking if they were fine (they were, at least until they got such calls, and might then have been left wondering whether the Treasury Secretary knew something that they didn’t), and then organizing a meeting of the “Plunge Protection Team” on Monday, Christmas Eve. This all created the sense of an administration in panic.

This comes on top of the reports over the weekend that Trump wants to fire the Chairman of the Fed, Jerome Powell.  Trump had appointed Powell just last year.  Nor would it be legal to fire him (and no president ever has), although some may dispute that.  Finally, and adding to the sense of chaos, a major part of the federal government is on shutdown starting from last Friday night, as Trump refused to approve a budget extension unless he could also get funding to build a border wall.  As of today, it does not appear this will end until some time after January 1.

But it is not just these recent events which may have affected the markets.  After all, the S&P500 index peaked on September 20.  Rather, one must look at the overall mismanagement of economic policy under Trump, perhaps most importantly with the massive tax cut to corporations and the wealthy of last December.  While a corporate tax cut will lead to higher after-tax corporate profits, all else being equal, all else will not be equal.  The cuts have also contributed to a large and growing fiscal deficit, to a size that is unprecedented (even as a share of GDP) during a time of full employment (other than during World War II).  A federal deficit which is already high when times are good will be massive when the next downturn comes.  This will then constrain our ability to address that downturn.

Plus there are other issues, such as the trade wars that Trump appears to take personal pride in, and the reversal of the regulatory reforms put in place after the 2008 economic and financial collapse in order not to repeat the mistakes that led to that crisis.

What will happen to the stock market now?  I really do not know.  Perhaps it will recover from these levels.  But with the mismanagement of economic policy seen in this administration, and a president who acts on whim and is unwilling to listen, it would not be a surprise to see a further fall.  Just don’t try to shift the blame to the Fed.