An Update on Progress in the Labor Market Recovery Under Obama

Cumul Private Job Growth from Inauguration to Oct 2015

Cumul Govt Job Growth from Inauguration to Oct 2015

A)  Introduction

The Bureau of Labor Statistics released on November 6 its most recent report on the state of the job market.  It was a strong report, with net job gains of 271,000 in October and the unemployment rate falling to 5.0%.  One should not, however, put too much weight on the figures in just one month’s report.  Indeed, the report for October followed relatively weaker reports in the two previous months.  Rather, one should put all these reports in the longer term context of how the labor market has moved in recent years.  And what they show is continued, and remarkably steady, improvement.

This post will look at that longer term context by updating several labor market charts that have been discussed in previous posts on this blog.  It will look first at net job growth in the private sector and in the government sector in the period since Obama’s inauguration, with a comparison to the similar period during George W. Bush’s term.  The post will then look at the continued fall in the unemployment rate, with a comparison to the similar period under Reagan, and finally to the share of part time workers in total employment.  The last is to see whether there is any evidence to support the assertion coming from Republican critics that Obamacare has led to a shift by employers to part time workers so that they can avoid providing health insurance in the overall wage compensation package for their staff.  We will find that there is no indication in the data that this has been the case.

B)  Total Job Growth

The charts at the top of this post show total net job growth, in the private sector and in the government sector, in the period since Obama’s inauguration (up to October 2015) and under Bush (for his two full terms).  They update similar charts discussed in several earlier posts on this blog, most recently from June 2014.

Private sector job growth has been strong under Obama, and continues to be.  And the record is clearly far better than that under the George W. Bush administration.  There has been a net increase of 9.3 million new private jobs under Obama since the month he was inaugurated, versus just 4.0 million new private jobs over the similar period in the Bush administration.  Furthermore, this 4.0 million additional private jobs was close to the peak achieved in the Bush years, before it started to fall and then plummet as the housing bubble burst and the economy collapsed in the last year of his second term.  By the end of his presidency there were fewer private jobs than there were on the day he was inaugurated, eight years before.

Obama faced this collapse in the jobs market as he took office.  The economy was losing 800,000 private jobs per month, with the economy contracting at the fastest pace since the Great Depression.  The new administration was able to turn this around with the stimulus package and with aggressive Fed actions, with the fall in employment first slowing and then turning around.  The result has been a net growth of 13.5 million new private jobs from the trough just one year into the new administration until now.

Government jobs, in contrast, have been cut.  This hurt total job growth both directly (government jobs are part of total jobs obviously) as well as indirectly.  Indirectly, the government job cuts (as well as the fiscal austerity that began in 2010) reduced demand for goods and hence production at a time when the economy was still depressed and suffering from insufficient demand to keep production lines going.  As discussed in an earlier post on this blog, without the fiscal austerity introduced from 2010 onwards the economy would have recovered from the economic downturn by 2013 and perhaps even 2012.  The initial stimulus package in 2009 turned things around.  It is unfortunate that the government then moved to cuts from 2010 onwards, which reduced the pace of the recovery.

It should be recognized that government jobs as recorded here include government jobs at all levels (federal, state, and local), with federal government jobs only a relatively small share of the total (12.4%).  But government jobs have fallen at all three levels, federal as well as state and local.

The cuts on government jobs during Obama’s time in office stand in sharp contrast to the growth in government jobs during Bush’s two terms.  Yet Obama is charged with being a big government liberal while the Republicans claim to be small government conservatives.

C)  The Rate of Unemployment
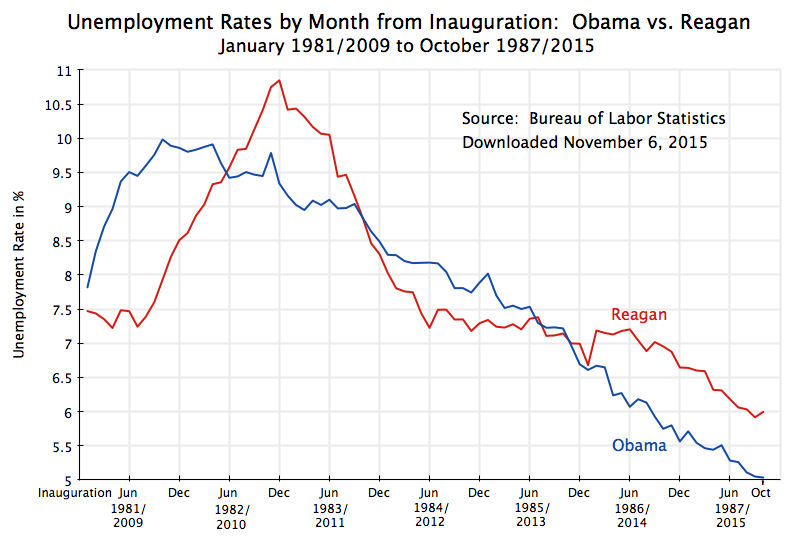
Unemployment Rates - Obama vs Reagan, up to Oct 2015After peaking at 10.0% in October 2009, the rate of unemployment has fallen at a remarkably steady pace under Obama (aside from the monthly fluctuations in the reported figures, which will in part be statistical noise as unemployment estimates come from household surveys).  This was discussed in this earlier post on this blog.  The record is certainly better than that under Reagan.  The unemployment rate is now 5.0%, while it was still 6.0% at the same point in the Reagan presidency.

Furthermore, Reagan was not confronted, as Obama was, with an economy in collapse as he took office.  Rather, unemployment began to rise only about a half year after Reagan took office, as he began to implement his new budgetary and other policies.  The unemployment rate then rose to a peak of 10.8% in late 1982 before starting to fall.  And while the recovery was then rapid for a period, supported by rising government spending, it stalled by mid-1984 with unemployment then fluctuating in the range of 7.0% to 7.5% for most of the next two years.  One does not see the steady improvement as one has had under Obama.

With the unemployment rate now at 5.0%, it is expected that the Fed will soon start to raise interest rates.  This would be unfortunate in my view (as well as that of many others, such as Paul Krugman).  Inflation remains low (only 0.2% over the past year for personal consumption expenditures for all goods, or 1.3% over the past year if one excludes the often volatile food and energy costs).  And while wages ticked up by 2.5% over the year before in the most recent BLS labor market report, this is still below the roughly 3 1/2% increases that would be consistent (after expected productivity gains in a normally functioning job market) with the Fed’s 2.0% inflation target.  And if wages are not allowed to rise faster than inflation, then by definition there will be no increase in real wages.

It is of course recognized that the rate of unemployment cannot fall forever.  There will always be some slack in the labor market as workers transition between jobs, and if the unemployment rate is too low, there will be excessive upward pressure on wages, and inflation can become a problem.  But where that “full employment rate of unemployment” is, is not clear.  Different economists have different views.  It does not appear to be at 5.0% under current conditions, as the rate of inflation remains low.  But whether it is at 4.5% or 4.0% is not clear.  At some point, it would be reached.

When it is, the pace of job creation will need to fall to match the pace of labor force growth (from population growth).  Otherwise, by simple arithmetic, the rate of unemployment would continue to fall.  And this cut in employment growth would be the objective of the Fed in raising interest rates:  It would be to slow down the pace of job growth to the rate that matches labor force growth.

Once the Fed does start to raise interest rates, one should then not be surprised, nor criticize, that the pace of job growth has slowed.  That is the aim.  And it will need to slow sharply from what the pace of job growth has been in recent years under Obama.  Over the past two years, for example, employment growth has averaged 236,000 per month. The labor force has grown at a pace of 101,000 per month over this period.  As a result, unemployment has fallen at a pace of 135,000 per month (= 236,000 – 101,000), with this leading the unemployment rate to fall to 5.0% now from 7.2% two years ago.  If unemployment is now to be kept constant rather than falling, the pace of job growth will need to fall by more than half, from 236,000 per month to just 101,000 per month (or slightly more, to be precise, taking into account the arithmetic of a constant unemployment rate).

I have no doubt that when this happens, and the pace of job growth slows, that Obama will be criticized by his Republican critics.  But this will reflect a fundamental confusion of what full employment implies for the labor market.

D)  Part-Time Employment as a Share of Total Employment

Part-Time Employment #2 as Share of Total Employment, Jan 2007 to Oct 2015

Finally, it is of interest to update the graph in an earlier post to see whether there is now any evidence that the Affordable Care Act (Obamacare) has led employers to fire their regular full time workers and replace them with part-timers, in order to avoid the mandate of including health insurance coverage in the wage compensation package they pay to their workers.  Conservative politicians and media asserted this as a fact (see the earlier blog post cited for several references).  But as discussed before, and as confirmed with the more recent data, there is no indication in the data that this has been the case. Indeed, the share of part time workers in the total has been falling at an accelerated pace in the most recent two years, at a time when the Obamacare insurance mandate provisions have come into effect.

The acceleration in the pace of this improvement is consistent with the improvement seen in the overall labor market over the past several years, as discussed above.  As the economy approaches full employment, those who are working part time (not by choice, but because they have no alternative) are able to find full time jobs.  The share of part-time workers in total employment is still somewhat above (at about 4%) what would be normal when the economy is at full employment (at about 3%), lending support to those arguing that while the labor market is improving, we are not yet at full employment (and the Fed should thus wait longer before it starts to raise interest rates).  But it is getting better.

I have also added to the graph a line (in red) showing what the share of part-time employment workers were in total employment during the Reagan years.  At the comparable time in his presidency, the share was higher than what it is now under Obama.  Furthermore, it had improved only slowly under Reagan over the three years leading up to that point.  Yet Reagan is praised by conservatives for his purportedly strong labor market.

E)  Conclusion

The labor market has improved considerably in recent years under Obama.  It could have been better had the government not turned to austerity in 2010, but even with the government cuts, job growth has been reasonably good.  The unemployment rate has now fallen to 5%, and it is expected the Fed will soon begin to raise interest rates in order to slow the pace of job creation.  One should not then be surprised if fewer net new jobs are created each month, nor criticize Obama when it does.  That will be precisely the aim of the policy.  But I strongly suspect that we will nonetheless hear such criticisms.

The Strong Recovery in Employment Under Obama

Unemployment Rates - Obama vs Reagan

A.  The December Jobs Report

The Bureau of Labor Statistics released on Friday its regular monthly report on employment.  Job growth was once again strong.  Total jobs (nonfarm payroll employment, to be precise) rose by a solid 252,000 in December, and the unemployment rate came down to 5.6%.  Total jobs rose by an even higher (and upwardly revised) 353,000 in November and by an also upwardly revised 243,000 in October (the two most recent monthly figures are always preliminary and subject to revision).  These are all good numbers.  The 353,000 figure for job gains in November was the highest monthly figure in over nine years.

The overall job gain in 2014 came to 2.95 million.  This was the highest annual total since 1999.  Private sector jobs rose by 2.86 million in 2014.  This was the highest annual gain in private jobs since 1997.  Government jobs (federal, state, and local) also grew, although only by 91,000 and equal to just 3% of the overall growth in jobs of 2.95 million.  But at least it was positive and stopped being the drag on growth it had been before through repeated cuts.  Government jobs had been cut each and every year since 2009, reducing American jobs by 702,000 between 2009 and 2013.

B.  Obama’s Performance on Unemployment, Compared to Reagan’s

While the pace of improvement has accelerated in the past year, the Obama record on jobs has in fact been a good deal better for some time than he has been given credit for.  Critics said that Obama’s policies, both as a consequence of the passage of the Obamacare health reforms and from his use of government regulatory powers, would (they asserted) constrain job growth and keep unemployment high.  These critics look to the Reagan presidency as a model, with the belief that there was a rapid fall in unemployment following his tax cuts, attacks on unions, and aggressive deregulatory actions.  This adulation continues.  A recent example was a column by Stephen Moore (Chief Economist of the Heritage Foundation) published in the Washington Post just two weeks ago (and which a number of commentators, including Paul Krugman, noted was full of errors).

But how do the Obama and Reagan records in fact compare?  The graph at the top of this post shows the path the rate of unemployment has taken during Obama’s presidency, and for the same period during Reagan’s presidency.  Both curves start from their respective inaugurations.

Unemployment under Reagan was high when he took office (at 7.5%), although on a downward trend.  But it then rose quickly (peaking at 10.8%) followed by a fall at a similar pace, before leveling off at a still high 7 to 7 1/2%.  It then fell only slowly for the next two and a half years, by a total of just 0.6% points.  The recovery in terms of the unemployment rate lacked strong staying power.

The pattern was different under Obama.  While unemployment was also high when he took office (7.8%), it was rising rapidly as the economy was losing 800,000 jobs a month.  It rose to a peak of 10.0% nine months later, before starting a fall that has continued to today.  The pace of the reduction was relatively steady over the years, but accelerated in 2014.  Over the last two and a half years, the unemployment rate has been reduced by 2.6% points, far better than the 0.6% reduction for the comparable period under Reagan.

As a result, the unemployment rate is now 5.6% under Obama, versus 6.6% at the same point in Reagan’s tenure.  By this measure, performance has been better under Obama than it was under Reagan.  The 5.6% rate under Obama can also be compared to Mitt Romney’s statement in 2012, during his presidential campaign, that adoption of his policies would bring the unemployment rate down to 6% by January 2017.  Romney viewed this as an ambitious goal, but achievable if one would follow the policies he advocated.  It was achieved under Obama already by September 2014.  One did not hear, however, any words of congratulations from Romney or others in the Republican Party to mark that success.

Of possibly more interest in the debate about the response to the respective policy regimes of Obama vs. Reagan, was the flattening out of unemployment under Reagan at the still high level of 7.5% or close to it in mid-1984.  If his “supply-side” policies were going to be effective in bringing down unemployment, this was the period when they should have been working.  The tax cuts had been passed, and the regulatory and other policies of the Reagan administration were being implemented and enforced.  But unemployment was trending down only slowly.  In contrast, unemployment was falling rapidly for the same period in the Obama presidency, with the pace of reduction indeed accelerating in 2014.  There is absolutely no evidence that Obamacare, actions to protect the consumer or the environment, the application of government regulations under Obama, or even “policy uncertainty” (a new criticism of Obama that was given prominence during the 2012 campaign), have acted to slow job growth.

C.  A Few More Points

1)  Why did unemployment rise rapidly from mid-1981 to late-1982 (to 10.8%), and then fall at almost the same rapid rate from that peak to mid-1984?  This had less to do with the policies of Reagan than of those of Paul Volcker, then Chairman of the Federal Reserve Board (and a Jimmy Carter appointee).  Volcker and the Fed raised interest rates sharply to bring down inflation, with the federal funds rate (the interest rate at which banks lend funds on deposit at the Fed to each other; it is the main policy target of the Fed) reaching over 19% at its peak.  Inflation came down, the Fed then reduced interest rates, and the economic downturn that the Fed policy had induced was then reversed.  Unemployment thus rose fast, and then fell fast.

2)  Has the fall in the unemployment rate under Obama been more a reflection of people dropping out of the labor force than a recovery in jobs?  No.  A previous post on this blog looked at this issue, and found that labor force participation rates have been following their long term trends.  There is no evidence that labor force participation rates have made a sudden shift in recent years.

3)  Why has the pace of improvement in the unemployment rate accelerated in 2014?  As earlier posts on this blog have noted,  Obama is the only president in recent history where government spending has been cut in a downturn.  The resulting fiscal drag pulled back the economy from the growth it would have achieved had government spending, and its resulting demand for goods and services and hence jobs to produce those goods and services, not been cut.

But this finally turned around in 2014.  Congress finally agreed to a budget deal with Obama, and state and local governments saw spending stabilize and then start to rise as the recovery got underway and boosted tax revenues.  The result is shown in this chart, copied from an earlier post whose focus was on austerity policies in Europe:

Govt Expenditures, Real Terms - Eurozone and US, 2006Q1 to 2014 Q2 or Q3

Total US government expenditures (federal, state, and local; in real terms; and for all purposes, including both direct purchases of goods and services and for transfers to households such as for Social Security and Medicare), turned around in the first quarter of 2014 and began to rise.  Government spending had previously been falling from mid-2010.  With that turnaround in government spending, GDP rose by 4.6% (at an annualized rate) in the second quarter of 2014 and by 5.0% in the third quarter.  Much more was going on, of course, and one cannot attribute all moves in GDP growth to what has happened to government spending.  But the turnaround in government spending meant that this component of GDP stopped acting as the drag on growth that it had been before.

Jobs then grew in 2014 at the most rapid rate since 1999, and unemployment fell.  The unemployment rate of 5.6% is the lowest since 2008, the year the economy entered into the economic collapse that marked the end of the Bush administration.

D.  How Much Further Does Unemployment Need to Fall to Reach Full Employment?

The 5.6% rate is not yet full employment.  While it might appear to some to be a contradiction in terms, there will always be some unemployment in an economy, even at “full employment”.  There will be frictions as workers enter and leave jobs, mismatches in skills and in geographic location, and so on.  But the 5.6% rate is still well above this.

Historically, the US economy was often able to achieve far lower rates of unemployment and not see excessive upward pressure on wages and prices.  The unemployment rate was at 4.4% in 2006/07, at 3.9% in 2000, and at 4.0% or below continuously from late 1965 through to early 1970 (and reached 3.5% or below for a full year from mid-1968 to mid-1969).  It even dipped to a post-war low of 2.5% in 1953, although few would say that the conditions then would apply to now.

Based on such historical measures, the unemployment rate could still be reduced substantially from where it is now before the labor market would be so tight as to cause problems.  Economists debate what that rate might be at any given time, but personally I would say that a reasonable target would be no higher than 4 1/2%, and perhaps as low as 4%.

But rather than try to predict what the full employment rate of unemployment might be, one can follow a more operational approach of continuing to push down the rate of unemployment until one sees whether upward wage and price pressures have developed and become excessive.  That is how the Fed operates and determines what policy stance to take on interest rates.  And there is absolutely no sign whatsoever that there is such upward wage or price pressure currently, with the unemployment rate of 5.6%.

As a number of the news reports on the December BLS employment report noted, while unemployment has come down, estimated hourly earnings in December also fell by 5 cents from the previous month (to $24.57 for all private non-farm jobs, from $24.62 the previous month).  Such a one-month change is not really significant, and could be due to statistical fluctuations (as the data comes from a survey of business establishments).  But what is significant is that average hourly earnings in recent years have only kept pace with low inflation of less than 2% a year.  In real terms, wages today are almost exactly the same as they were in late 2008.  This has been the case even though labor productivity is about 10% higher now than in late 2008 (this figure is an estimate, as the GDP figures for the fourth quarter of 2014 have not yet been reported).  In a properly functioning labor market, real wage growth will be similar to labor productivity growth.  But high unemployment since the 2008 downturn has weakened labor’s bargaining position, leaving real wages flat.

Government policy, including actions by the Fed, should be to keep the expansion going at as fast a pace as possible until unemployment has fallen so low that one sees upward pressures on wages and hence prices.  As I noted above, I would not expect to see that until the unemployment rate falls below 4 1/2%, and quite possibly below 4%.

At One Time, You Could Work Your Way Through College – But Not Any More.

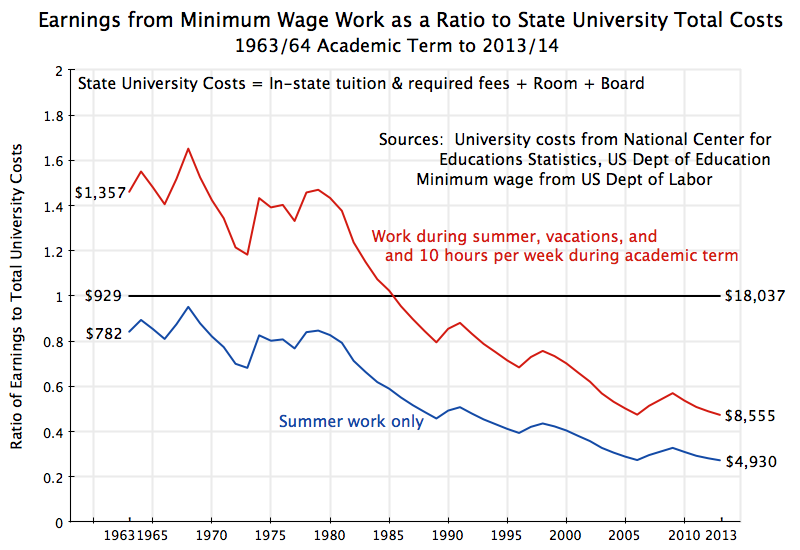
Earnings from Min Wage vs. University Costs, 1963-2013


At one time, not that long ago, a student could work at a minimum wage job over the summers and during holidays, and be able to cover the total cost (including room and board) of attending a four-year state university.  That is now far from possible.

With students now returning to school, it is perhaps a good time to look at what has happened to the affordability of college in recent decades for middle class families.  The chart above provides one indicator.  It compares what a student could earn in a summer job at the minimum wage, or in year-round work at the minimum wage while attending school (i.e. during summers, holidays, and part time during the academic term), as a ratio to what it would cost to attend a four-year state university.

The state university costs are for in-state tuition and required fees, plus the cost of on-campus room and board.  The figures are from the National Center for Education Statistics of the US Department of Education (with figures for 2013 calculated based on the 2012 to 2013 growth in the College Board estimates).  The university cost figures are for four-year, degree granting, state colleges and universities (i.e. they do not include two-year community colleges), and cover all such state schools.  The cost of attending the elite state schools (such as Berkeley, UVA, or the University of Michigan) would be more.  The years shown on the chart are for the beginning of the respective academic years (i.e. 2013 is for the 2013/14 academic year), and the minimum wage rate used is that which was in effect in July of that year.

The chart indicates that one could have covered the cost of attending a state university in the 1960s and 70s solely through minimum wage work.  Based on just a 17 week summer break, one would have earned enough to cover an average of 82% of the full cost of attending school.  An industrious student working full time over the summer and during vacation breaks (such as Christmas), plus 10 hours per week during the academic term, would have been able to cover the full cost and more – an average of 143% of the cost of school.  Hence summer work plus a bit more during vacations would have sufficed to cover the full cost of college.  In terms of dollar figures, the full cost of attending a state university in 1963/64 would have been $929, in the then current dollars.  A student could have earned $782 just from working at minimum wage over the summer, or $1,357 by working at minimum wage over the summer, during vacations, and 10 hours per week during the academic term.

These are, of course, just simple indicators.  One might have been able to earn more than the minimum wage, and/or worked a different number of hours.  But the point is that in the 1960s and 70s, when baby boomers such as myself were going to college, it was possible for the student alone, simply by working at the minimum wage, to have paid for the full cost of attending a four-year state university.

That began to change in the 1980s, as Reagan took office.  The change is indeed striking.  Affordability then began to fall, and it has fallen steadily since, as seen in the chart above.  By 1986, a student working even full time over the summer and during vacation breaks, and 10 hours a week during the academic term, no longer would have been able to cover the full cost of attending school.

The share of schooling costs that could be covered by work then continued to decline (with some bumps up when the minimum wage was sporadically changed) until the present day.  By 2013, summer work would only cover a quarter of the cost of schooling, while more comprehensive work over the entire year would only cover less than half.  In dollar terms, the average cost of attending a state university (for tuition, room, and board) was $18,037 per year in 2013.  But a student working over the summer at the minimum wage would have only been able to earn $4,930, or only a bit over a quarter of the cost of attending school.  Working full time over the summer and during vacations, plus 10 hours per week during the academic term, the student could have only earned $8,555, or less than half the cost of attending school.

As a consequence, students must now rely on their parents (when their parents can afford it), or a scarce number of scholarships (highly limited, especially for state schools), or on student loans.  Otherwise, they must give up on attending university.

The result has been an explosion in student loan debt outstanding.  As of June 30, 2014, student loan debt totaled an estimated $1,275 billion (based on Federal Reserve Board estimates), or five times the level outstanding in 2003 of $250 billion (the earliest figures I could find on a comparable basis; the amounts were so small earlier, that the Fed did not separately break them out).  Student loans have long been common in the US (I had them when I went to school in the early 1970s).  But the amounts outstanding then were relatively small, were at low interest rates, and were for most of us easily manageable.  It is different now.  Student loan debts have exploded in recent years, with a five-fold increase over just the past decade.

The declining affordability of college by this measure is of course a consequence of what has been happening to the two components of the measure.  One has been the unwillingness of Congress to allow the minimum wage to keep up with inflation.  As noted in an earlier post on this blog, the minimum wage in the US has stagnated over the last half century, and is indeed lower now (in real terms) than it was in 1950, when Harry Truman was president.  Real GDP per capita is 3.5 times higher now than it was in 1950, and real labor productivity has increased similarly.  These are not small increases.  I find it amazing (and shameful) that the real minimum wage is lower now than it was then.

For the period since 1963 (the earliest date in the chart), real GDP per capita and real labor productivity are both now 2.7 times higher than what they were then.  But the real minimum wage is close to 20% less now than it was in 1963.

The fall in the real minimum wage fall since the 1960s is half the story.  Note that the inflation measure used for determining the real minimum wage is the general consumer price index (the CPI).  This is the price index for the overall basket of goods and services a US household will purchase.  But the price index is an average over all the goods and services that households buy, and individual items can have price increases that are more than, or less than, this overall average.

In particular, the cost of attending a state university has increased by a good deal more than the overall CPI.  Based on the overall CPI, the real cost of attending a state university (for tuition, room, and board) is now 2.5 times what it was in 1963.  The cost of the tuition component alone is now 4.5 times higher.  The basic cause has been the cutbacks in state budgetary support for their colleges and universities, with tuition and other charges then increased to make up for it.

As a result, the minimum wage has fallen in real terms (based on the overall CPI) since the 1960s, at the same time that the real cost of attending school (relative to the overall CPI) has increased sharply.  The two factors together account for the steep fall in the share of state university costs that one can pay for by working at the minimum wage.  The curves in the chart at the top of this post show that path.

It is important to recognize that this declining affordability of attending state schools was not inevitable, but rather the result of policy choices.  The minimum wage has not been adjusted to reflect general inflation, even though real GDP per capita and labor productivity have both grown substantially.  And as was discussed in another post on this blog, there is no evidence that raising the minimum wage by the modest amounts now being discussed would lead to adverse effects on employment.

Government support for state colleges and universities has also been scaled back, leading to tuition and other cost increases substantially higher than that reflected in the general price index.  This has also been a policy choice.  And it is a policy choice that has prioritized the present generation (with tax cuts a prime example) over the coming generation, that is denying many of the coming generation the educational opportunities we ourselves had.