The US came close to defaulting on its public debt in August 2011, when Congressional Republicans refused to raise the debt ceiling unless their demands were met. And the public discussion and what was presented in the press accepted the view that to bring the US budget dynamics back to a sustainable path would require drastic cut-backs in federal expenditures. Of necessity, it was said, this would have to include drastic cut-backs in important social support programs, which would devastate the lives of many who were struggling to get by. Not surprisingly given these presumptions, the deficit and debt issues are still not resolved.
Actually, the issue is not that difficult, at least for the next decade. While there will, indeed, be long term problems that need to be addressed in the US budget dynamics, these will not arise until the 2020s and 2030s. They will stem at that time from rising medical costs coupled with an aging population, and will need to be addressed by health system reform (which the Obama reforms start to address, but do not go far enough). But as will be shown below, the issue through at least 2022 would be fully addressed provided one allows the Bush tax cuts to be phased out (and under current law, they are due to expire), leading us back to tax rates under which the economy performed quite well during the Clinton years.
One first needs to understand what led to the current budgetary problems, problems which (due to Congressional brinkmanship) almost led to the US Government defaulting on its debt last summer. One can then work out alternative scenarios for the fiscal accounts, to examine “what if” questions to see the impacts of certain policy decisions. These are worked out below, using numbers made available by the Congressional Budget Office, in its recent, January 31, 2012, report titled “The Budget and Economic Outlook: Fiscal Years 2012 to 2022”. The calculations were somewhat complex to work out (it is especially important to include the feedback from higher or lower fiscal deficits on the future interest payments then due on the resulting debt; many analysts ignore this). But I was then surprised by how quickly the fiscal accounts would stabilize provided only that the Bush tax cuts were phased out. Not more is needed.
We can start with the fiscal accounts based on the historic actuals between fiscal years 1972 and 2011, and then (for 2012 to 2022) as projected by the CBO under its current policy scenario. The current policy scenario (which the CBO calls its “Alternative Fiscal Scenario”) assumes that the Bush tax cuts will be renewed and that the “automatic” spending reductions mandated under last year’s Budget Control Act will not in fact happen (and also that compensation of doctors under Medicare is kept as now rather than being cut: but this is minor). The resulting fiscal accounts look like this:
 One sees here the deterioration in the accounts during the Reagan presidency, as revenues were cut (the Reagan tax cuts) and outlays were increased (defense expenditures) leading the public debt to GDP ratio to almost double during the Reagan and Bush I years, from 26% in 1981 to almost 50% in 1993. Outlays were then reduced and revenues increased during the Clinton years, reducing the deficit and in fact leading to a surplus by 1998. The public debt to GDP ratio fell sharply. Bush II then cut taxes sharply soon after taking office in 2001 and increased outlays, leading back to deficits, and the public debt to GDP ratio started to rise again.
Revenues then fell sharply in 2008 and especially in 2009 as a result of the 2008 economic collapse as well as tax cuts aimed at stimulating the economy. Outlays rose in the downturn to cover increased expenditures on unemployment compensation and similar support programs, as well as a consequence of the Obama stimulus measures enacted in response to the sharpest downturn the US had faced since the Great Depression. Under the CBO projections going forward, outlays are expected to remain well above revenues, leading only to a gradual fall in the deficit. The public debt to GDP ratio then explodes, reaching 94% of GDP in 2022 and still rising.
This scenario is pretty grim and is clearly not sustainable. Hence the agreement by all that something needs to be done. But first it is important to see why the fiscal situation deteriorated so much since 2001, when Bush II took office. There were two main reasons: the Bush tax cuts, and the decision to fight major and lengthy wars in Iraq and Afghanistan without taking any step whatsoever to pay for them other than through borrowing.
Of these two, the Bush tax cuts are the more important. The CBO estimates that the Bush tax cuts will lead to reductions in collected tax revenues of about 2.5% of GDP each year going forward (up to 2020 when the losses are projected to rise a bit to 2.6%, and then to 2.7% of GDP in 2021 and 2022). Over a twenty year period, and considering also the resulting higher public debt and hence the interest due on this higher debt, this is huge.
The unfinanced wars in Iraq and Afghanistan have also been costly. Based on CBO estimates, the wars have cost on average 1.0% of GDP each year between 2003 and 2011, and will decline only modestly in 2012 and 2013.
Using the CBO data, one can then calculate what the fiscal picture would have been, and what it would then be expected to be, had the Bush tax cuts never been passed, and had the Iraq and Afghan wars not been started (or, in terms of the impact on the deficit and the debt, had they been paid for by current taxes rather than borrowing). Under this scenario the budget is in surplus and debt falls rapidly until the shock of the 2008 crisis. And the deficit and the debt then stabilize quickly after that shock:

Note the scale here is different from that in the figure above. With just these two changes, and leaving all else as before (including the economic collapse of 2008, even though some have argued it would not have then been so severe), the fiscal deficit diminishes and becomes a surplus by 2020, and the public debt to GDP ratio levels off and then starts to fall by 2014/15. (Note for those not familiar with such dynamics: The debt to GDP ratio can fall even while the public accounts are in a modest deficit because of GDP growth, which increases the denominator in the debt to GDP ratio.) The public debt to GDP ratio peaks at 35% of GDP, well below what it reached during the Reagan / Bush I period.
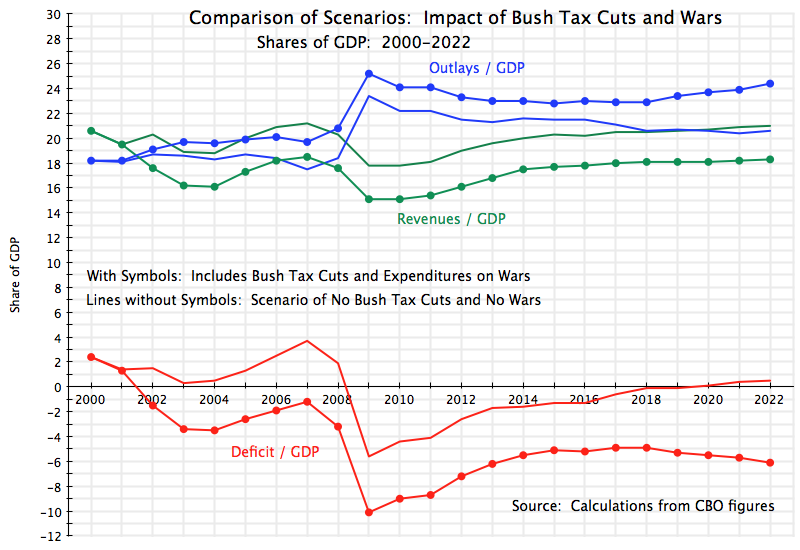
Putting the two scenarios together on one figure allows for easier comparison:
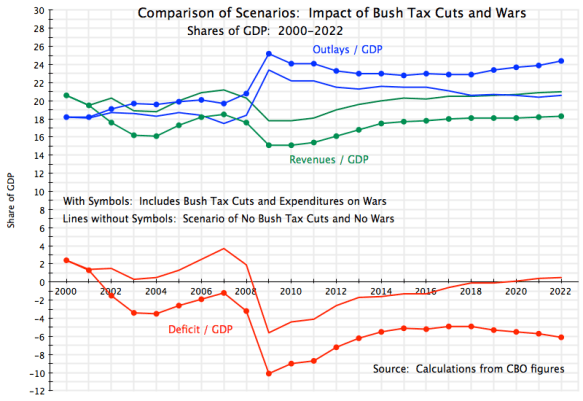 All is the same until 2001, so this focusses only on 2001 to the projected 2022. Revenues are always substantially lower as a result of the Bush tax cuts. Outlays are always higher, for two reasons: the costs of the Iraq and Afghan wars, and then, growing over time, due to outlays for interest on a growing public debt as a result of the deficits. Deficits are always substantially higher with the Bush tax cuts and wars, and worsen over time due to growing interest expenditures.
And the impact on the public debt to GDP ratios is particularly stark:
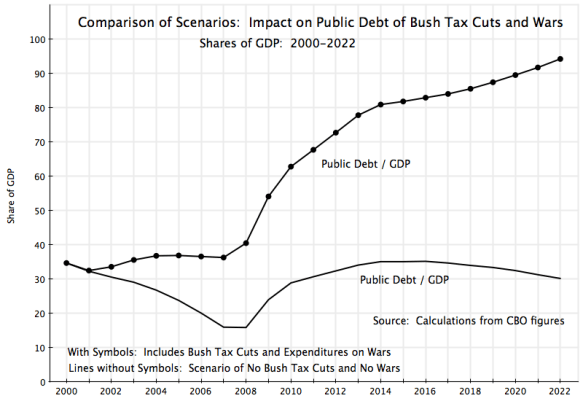 The cause of the fiscal mess we are in is therefore clear: without the Bush tax cuts and the unfinanced Iraq and Afghan wars, the fiscal accounts would not have worsened so much in the 2008 economic collapse, and would soon be back on a sustainable path. This is taking all else as equal, including all other revenues and expenditures, as well as overall economic growth. While it is certainly fair to note that all else would likely not then have been equal, there is no evidence to support the Republican argument that higher taxes (without the Bush tax cuts) would have stifled economic growth. Without the Bush tax cuts, one would have had tax rates as they were during the Clinton years, when the economy grew well. Why would taxes have suddenly become such a problem? And growth during the Bush years was in fact quite poor (and terrible if one measures it by growth over his two full terms, with the 2008 collapse at the end of his second term). The lower taxes under the Bush tax cuts did not lead to better growth than what the US economy achieved during the Clinton years. It was far worse.
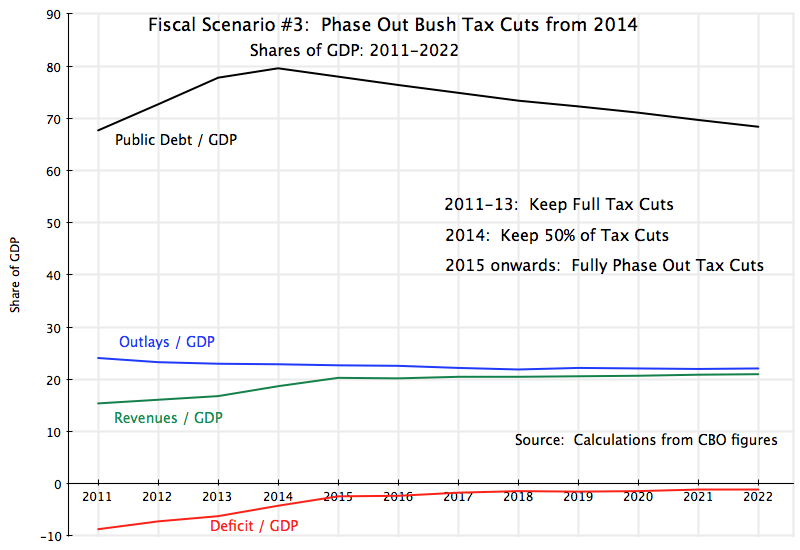
It is also fair to note that while the above may help us understand better the causes of the current fiscal mess, it does not by itself tell us how to solve the mess. We cannot change the past. But it does point out that re-establishing prior tax rates would be a clear place to start. And it turns out that by themselves they would be more than enough:
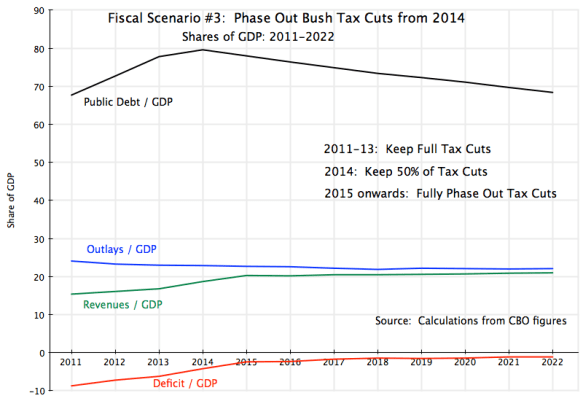
This scenario assumes that the Bush tax cuts will be phased out starting in 2014 (and not earlier, as the economy has not yet fully recovered from the 2008 economic collapse), with 50% phased out in 2014 and 100% phased out from 2015 and onwards. This, by itself, puts the economy on a stable and sustainable fiscal path. The public debt to GDP ratio peaks in 2014 and then starts to fall, and the fiscal deficit falls steadily if slowly, to just 1% of GDP by 2021. Revenues stabilize at about 21% of GDP and outlays at 22% of GDP.
In summary, the Bush tax cuts enacted in 2001 and 2003 (and extended in 2010 for two further years, through 2012), plus the costs of the unfinanced Iraq and Afghan wars, have undermined the US fiscal accounts, to the extent they are now unstable and lead to explosive growth in debt. Had these decisions not been taken, the fiscal accounts would be quite stable, even with the extraordinary measures that were necessary (and the decline in fiscal revenues received) due to the economic collapse of 2008 and the then slow recovery. But even with the debts incurred due to the Bush tax cuts and his unfinanced wars, the fiscal accounts can be put on a sustainable path simply by phasing out the tax cuts starting in 2014.






You must be logged in to post a comment.