
A. Introduction
The public letter was scathing, and deliberately so. Made available to the news media in April 2010 just as President Obama was preparing to deliver a major speech on his administration’s strategy to put the US space program back on track, the letter bluntly asserted that the new approach would be “devastating”. Signed by former astronauts Neil Armstrong (Commander of Apollo 11, and the first man to walk on the moon), Jim Lovell (Commander of the ill-fated Apollo 13 mission), and Eugene Cernan (Commander of Apollo 17, and up to now the last man to walk on the moon), the letter said that reliance on commercially contracted entities to carry astronauts to orbit “destines our nation to become one of second or even third rate stature”. The three concluded that under such a strategy, “the USA is far too likely to be on a long downhill slide to mediocrity”.
What was the cause of this dramatic concern? Upon taking office in January 2009, the Obama administration concluded that a thorough review was needed of NASA’s human spaceflight program. Year’s earlier, following the breakup of the Columbia Space Shuttle as it tried to return from orbit – with the death of all on board – the Bush administration had decided that the Space Shuttle was not only expensive but also fundamentally unsafe to fly. Due to its cost while still flying the Shuttle, NASA did not have the funds to develop alternatives. The Bush administration therefore decided to retire the then remaining Space Shuttles by 2010. The Obama administration later added two more Space Shuttle flights to allow the completion of the International Space Station (ISS), but the final Space Shuttle flight was in 2011. The Bush administration plan was that the funds saved by ending the Space Shuttle flights would be used to develop what they named the Constellation program. Under Constellation, two new space boosters would be developed – Ares I to launch astronauts to the ISS in low earth orbit and Ares V to launch astronauts to the moon and possibly beyond. A new spacecraft, named Orion, to carry astronauts on these missions would also be developed.
To fund Constellation, the Bush administration plan was also to decommission the ISS in 2015, just five years after it would be completed. Work on the ISS had begun in 1985 – when Reagan was president -, the first flight to start its assembly was in 1998, and assembly was then expected to be completed in 2010 (in the end it was in 2011). The total cost (as of 2010) had come to $150 billion. But in order to fund Constellation, the Bush administration plan was to shut down the ISS just five years later, and then de-orbit it for safety reasons to burn it up in the atmosphere.
The Obama administration convened a high-level panel to review these plans. Chaired by Norman Augustine, the former CEO of Lockheed Martin (and commonly referred to as the Augustine Commission), the committee issued its report in October 2009. They concluded that the Constellation program was simply not viable. Their opening line in the Executive Summary read “The U.S. human spaceflight program appears to be on an unsustainable trajectory.” Mission plans (including the time frames) were simply unachievable given the available and foreseeable budgets. There would instead be billions of dollars spent but with the intended goals not achieved for decades, if ever. A particularly glaring example of the internal inconsistencies and indeed absurdities was that the Aries I rocket, being developed to ferry crew to the ISS, would not see its first flight before 2016 at the earliest. Yet the ISS would have been decommissioned and de-orbited by then.
The Augustine Commission recommended instead to shift to contracting with private entities to ferry astronauts to orbit. Such a program for the ferrying of cargo supplies to the ISS had begun during the Bush administration. By 2009 this program was already well underway, and the first such flight, by SpaceX using its Falcon 9 rocket, was successfully completed in May 2012. The commission also recommended that work be done to develop the technologies that could be used to determine how a new heavy-lift launch vehicle should best be designed. For example, would it be possible to refuel vehicles in orbit? If so, the overall size of the booster could be quite different, as there would no longer be a need to lift both the spacecraft and the fuel to send it on to the Moon or to Mars or to wherever, all on one launch. And the commission then laid out a series of options for exploration that could be done with a new heavy-lift rocket (whether a new version of the Ares V or something else), including to the Moon, to Mars, to asteroids, and other possibilities. It also recommended that the life of the ISS be extended at least to 2020.
And it was not just the Augustine Commission expressing these concerns. Earlier, in a report issued in August 2009, the GAO stated that “NASA is still struggling to develop a solid business case … needed to justify moving the Constellation program forward into the implementation stage”. It also noted that NASA itself, in an internal review in December 2008 (i.e. before Obama was inaugurated) had “determined that the current Constellation program was high risk and unachievable within the current budget and schedule”. The GAO also noted that Ares I was facing important technical challenges as well (including from excessive vibration and from its long narrow design, where there was concern this might cause it to drift into the launch tower when taking off). While it might well be possible to resolve these and other such technical challenges given sufficient extra time and sufficient extra money, it would require that extra time and extra money.
President Obama’s strategy, as he laid out in a speech at the Kennedy Space Center on April 15, 2010 (but which was already reflected in his FY2011 budget proposals that had been released in February), was built on the recommendations of the Augustine Commission. The proposal that received the most attention was that to end the Ares I program and to contract instead with competing commercial providers to ferry crews to the ISS. And rather than continue on the Ares V launch vehicle (on which only $95 million had been spent by that point, in contrast to $4.6 billion on Ares I), the proposal was first to spend significant funds (more than $3 billion over five years) to develop and test relevant new technologies (such as in-orbit refueling) to confirm feasibility before designing a new heavy-lift launch vehicle. That design would then be finalized no later than 2015. Third, work would continue on the Orion spacecraft, but with a focus on its role to carry astronauts beyond Earth orbit, as well as to serve as a rescue vehicle should one be needed in an emergency for the ISS. Fourth, the life of the ISS itself would be extended to at least 2020 from the Bush plan to close and destroy it in 2015. And fifth, Obama proposed that the overall NASA budget be increased by $6 billion over five years over what had earlier been set.
While the proposal was well received by some, there were also those who were vociferously opposed – Armstrong, Lovell, and Cernan, for example, in the letter quoted at the top of this post. But perhaps the strongest, and most relevant, opposition came from certain members of congress. Congress would need to approve the new strategy and then back it with funding. Yet several key members of Congress, with positions on the committees that would need to approve the new plans and budgets, were strongly opposed. Indeed, this opposition was already being articulated in late 2009 and early 2010 as the direction the Obama administration was taking (following the issuance of the Augustine Commission report) was becoming clear.
Perhaps most prominent in opposition was Senator Richard Shelby of Alabama, who repeatedly spoke disparagingly of the commercial competitors (meaning SpaceX primarily) who would be contracted to ferry astronauts to the ISS. In a January 29, 2010, statement, for example (released just before the FY2011 budget proposals of the Obama administration were to be issued), Shelby asserted “China, India, and Russia will be putting humans in space while we wait on commercial hobbyists to actually back up their grand promises”. Shelby called it “a welfare program for amateur rocket companies with little or nothing to show for the taxpayer dollars they have already squandered”.
Shelby was not alone. Other senators and congressmen were also critical. Most, although not all, were Republicans, and one might question why those who on other occasions would articulate a strong free-market position, would on this issue argue for what was in essence a socialist approach. The answer is that under the traditional NASA process, much of the taxpayer funds that would be spent (many billions of dollars) would be spent on federal facilities and on contractors in their states or congressional districts. The Marshall Space Flight Center in Huntsville, Alabama, was the lead NASA facility for the development of the Ares I and Ares V rockets, and Senator Shelby of Alabama was proud of the NASA money he had directed to be spent there. Senators and congressmen from other states with the main NASA centers involved or with the major contractors (Texas, Florida, Mississippi, Louisiana, Utah) were also highly critical of the Obama initiative to introduce private competition.
The outcome, as reflected in the NASA Authorization Act of 2010 (passed in October 2010) and then in the FY2011 budget passed in December, was a compromise. The administration was directed basically to do both. The legislation required that a new heavy-lift rocket be designed immediately, with the key elements similar to and taken from the Ares V design (and hence employ the same contractors as for the Ares V). It was eventually named the Space Launch System (or SLS – or as wags sometimes called it “the Senate Launch System” since the key design specifics were spelled out and mandated in the legislation drafted in the Senate). It also directed that the cost should be no more than $11.5 billion and that it would be in operation no later than the end of 2016. (As we will discuss below, the SLS has yet to fly and is unlikely to before 2022 at the earliest, and over $32 billion will have been spent on it before it is operational.)
The compromise also allowed the administration to proceed with the development of commercial contracts to ferry astronauts to the ISS, but with just $307 million allocated in FY2011 rather than the $500 million requested. For FY2011 to FY 2015, only $2,725 million of funding was eventually approved by congress, or well less than half of the $5,800 million originally requested by the Obama administration in 2010 for the program. As a result, the commercial crew program, as it was called, was delayed by several years. The first substantial contracts (aside from smaller amounts awarded earlier to various contractors to develop some of the technologies that would be used) were signed only in August 2012. At that time, $440 million was awarded to SpaceX, $460 million to Boeing, and $212.5 million to Sierra Nevada Corporation, to develop the specifics of their competing proposals to ferry astronauts to the ISS.
The primary contracts were then awarded to SpaceX and to Boeing in September 2014. NASA agreed to pay SpaceX a fixed total of $2,600 million, and Boeing what was supposed to be a fixed total of $4,200 million (but with an additional $287.2 million added later, when Boeing said they needed more money). Each of these contracts would cover the full costs of developing a new spacecraft (Crew Dragon for SpaceX and Starliner for Boeing) and then of flying them on the rockets of their choice (Falcon 9 for SpaceX and the Atlas V for Boeing) to the ISS for six operational missions (with an expected crew of four on each, although the capsules could hold up to seven). The contracts would cover not only the cost of the rockets used, but also the costs of an unmanned test flight to the ISS and then a manned test flight to the ISS with a crew of two or more. If successful, the six operational missions would then follow.
We now know what has transpired in terms of missions launched. While the SLS is still to fly on even a first test mission (the current schedule is for no earlier than November 2021, but many expect it will be later), SpaceX successfully carried out an unmanned test of its spacecraft (Crew Dragon) in a launch and docking with the ISS in March 2019, a successful test launch with a crew of two to the ISS in May 2020, an operational launch with a NASA crew of four to the ISS in November 2020, and a second operational launch with a NASA crew of four to the ISS in April 2021 (where I have included under “NASA” crews from space agencies of other nations working with NASA). The April 2021 mission also reused both a Crew Dragon capsule from an earlier mission (the one used on the two-man test flight in May 2020) and a previously used first stage booster for the Falcon 9 rocket. Previously, out of caution, NASA would only allow a new Falcon 9 booster to be used on these manned flights – not one that had been flown before. They have now determined that the reused Falcon 9 boosters are just as safe.
As I write this, the plans are for a third operational flight of the Crew Dragon, again carrying four NASA astronauts to the ISS, in late October or November 2021. And as I am writing this, SpaceX has just launched (on September 15) a private, all-civilian, crew of four for a three-day flight in earth orbit. They are scheduled to return on September 18. And there may be a second such completely commercial flight later in 2021.
Boeing, in contrast, has not yet been successful. While Boeing was seen as the safe, traditional, contractor (in contrast to the “amateur hobbyists” of SpaceX), and received substantially higher funding than SpaceX did for the same number of missions, its first, unmanned, test launch in December 2019, failed. The upper stage of the rocket burned for too long due to a software issue, and the spacecraft ended up in the wrong orbit. While they were still able to bring the spacecraft back to earth, later investigations found that there were a number of additional, possibly catastrophic, software problems. After a full investigation, NASA called for 61 corrective actions, a number of them serious, to be taken before the spacecraft is flown again.
As I write this, there have been further delays with the Boeing Starliner. After several earlier delays, a re-run of the unmanned test mission of the capsule was scheduled to fly on July 30, 2021. However, on July 29, a newly arrived Russian module attached to the ISS began to fire its thrusters due to a software error, causing the ISS to start to spin. While it was soon brought under control, the decision was made to postpone the flight test of the Boeing Starliner by a few days, to August 3, to allow time for checks to the ISS to make sure there was no serious damage from the Russian module mishap. But then, in the countdown on August 3 problems were discovered in the Starliner’s control thrusters. Many of the valves were stuck. On August 13, the decision was made to take down the capsule from the booster rocket, return it to a nearby facility, confirm the cause of the problem (it appears that Teflon seals failed), and fix it. There will now be a delay of at least two months, and possibly into 2022.
Thus the unmanned test flight of the Boeing Starliner will only be flown at least two and a half years (and possibly three years, or more) after the successful unmanned test flight of the SpaceX Crew Dragon capsule in March 2019. And as noted before, Boeing was supposed to be the safe choice of a traditional defense and space contractor, in contrast to the hobbyists at SpaceX.
While flight success is, in the end, the most important and easy to observe metric, also important is how much these alternative approaches cost. That will be the focus of this post. The cost differences are huge. While not always easy to measure (this will be discussed below), the differences in the costs between the traditional NASA contracting and the more commercial contracts that paid for the services delivered are so large that any uncertainty in the cost figures is swamped by the magnitude of the estimated differences.
We will first look at the costs of developing and flying the principal heavy-lift rockets now operational in the US. While they have different capabilities, which I fully acknowledge, the differences in the costs cannot be attributed just to that. We will then look at the costs of developing and flying the three capsule spacecraft we now have (or will soon have) in the US: the SpaceX Crew Dragon, the Boeing Starliner (more properly, the Boeing CST-100 Starliner), and the Orion being built under contract to NASA by Lockheed Martin. The differences in capabilities here are also significant, but one cannot attribute the huge cost differences just to that.
This blog post is relatively long, with a good deal of discussion on the underlying basis of the estimates for the various figures as well as on the capabilities (and comparability) of the various rockets and spacecraft reviewed. For those not terribly interested in such aspects of the US space program, the basic message of the post can be seen simply by focussing on the charts. They are easy to find. And the message is that NASA contracting on the commercial basis that the Obama administration proposed for the carrying of crew to the ISS (and which the Bush administration had previously initiated for the carrying of cargo to the ISS) has been a tremendous success. SpaceX is now routinely delivering both cargo and crews to orbit, and at a cost that is a small fraction of what is found with the traditional NASA approach. One sees this in both the development and operational costs, and the differences are so large that one cannot attribute this simply to differing missions and capabilities.
B. The Rockets Reviewed and Their History
The chart at the top of this post shows the cost per kilogram to launch a payload to low earth orbit by the primary heavy-lift launch vehicles currently being used (or soon to be used) in the US. This is only for the cost of an additional rocket launch – what economists call the marginal cost. The cost to develop the rocket itself is not included here, as that cost is fixed and largely the same whether there is only one launch of the vehicle or many. We will look at those development costs separately in the discussion below.
To get to the cost per kilogram, one must start with what each rocket is capable of carrying to low earth orbit and then couple this with the (marginal) cost of an additional launch. We will review all that below. But first a note on the data underlying these figures.
For a number of reasons, comparable data on the costs and even the maximum lift capacities of these various rockets are not readily available. One has to use a wide range of sources. Among the primary ones I used (for both the payload capacities and the costs of the rockets discussed in this and in the following sections, as well as for the costs for the spacecraft discussed further below), one may look here, here, here, here, here, here, here, here, here, here, here, here, here, here, here, here, here, here, here, here, here, here, and here.
There will, however, be issues with the precision of any such estimates, in particular for the costs. For a number of reasons, such comparisons (again especially of the costs) are difficult to make. Several of those reasons are discussed in an annex at the end of this post. Due to the difficulties in making such comparisons, differences in costs per kilogram of payload lifted to orbit of 10 or 20% certainly, but also even of 40 or 50%, should not be viewed as necessarily significant. However, we will see that the differences in costs between developing and launching rockets and spacecraft with the traditional NASA approach and the approach based on competition that Obama introduced to manned space flight are far greater than this. Indeed, we will see that the costs are several times higher, and often even an order of magnitude or more higher. Differences of such magnitude are certainly significant.
To start, rockets differ in capabilities, and one must adjust for that. The most important measure is lifting capacity – how many kilograms of payload can be carried into orbit:
 The rockets to be examined here are limited to US vehicles (hence none of those from China, Russia, Europe, and elsewhere) and to heavier boosters sizeable enough to carry manned vehicles. Ares I is included even though it flew on only one test flight (and only a partial one at that) before its development was ended, in order to show how its capacity would have compared to other launchers. It would be similar in size to the alternatives. But its (incomplete) development costs were already more than an order of magnitude higher than that of the Falcon 9, as we will discuss below.
The other boosters to be examined here are the Falcon 9 (of which there are two versions – with the first stage booster either expended or recovered), the Atlas V and Delta IV Heavy (both made by the United Launch Alliance – a 50/50 joint venture of Boeing and Lockheed Martin that, when formed in 2006, had a monopoly on heavy launch vehicles in the US), the Space Launch System (still to be tested in its first launch), and the Falcon Heavy (of which there are also two versions, with the first stage boosters either expendable or recoverable).
As noted, the Falcon 9 can be flown in two versions – with the first stage booster either expended (allowed to fall into the ocean) or recovered. Since the first stage of a rocket will normally be the most expensive part of a rocket, Elon Musk sought to develop a booster where the first stage could be recovered. And he did. (He also, for a time, sought to recover similarly the second stage of the Falcon 9, but ultimately abandoned this. The cost of a second stage is less, so there is less benefit in recovering it, while the difficulty, and hence the cost, is greater. He eventually concluded it was not worth it.)
The Falcon 9 first stage is recovered by flying it back either to the launch site or to a floating platform in the ocean, where it slows down and lands by re-igniting its engines. The videos can be spectacular. But this requires that a portion of the fuel be saved for the landing, and hence the maximum payload that can be carried is less. However, the cost savings (discussed below) are such that the cost per kilogram to orbit will be lower.
I have not been able to find, however, a precise figure for what the payload penalty will be when the first stage is recovered. SpaceX may be keeping this confidential. SpaceX does provide, at its corporate website, a figure for the maximum payload on a Falcon 9. It is 22,800 kilograms, but this has been interpreted to be what the payload will be when the first stage uses 100% of its fuel to launch the payload into orbit, with that booster then allowed to fall into the ocean. But a figure for what the maximum payload can be when the booster is recovered is not provided. The Wikipedia entry for the Falcon 9, for example, only provides a figure for what was a heavy load on an actual launch (with the booster recovered). This does not mean this would be the maximum possible load.
For the calculations here, I therefore used the payload capacity figures for the Falcon Heavy, taking the ratio between the payload that can be carried in the fully recoverable version to the payload in the expended version. Elon Musk has indicated that this payload penalty on the Falcon Heavy is about 10%. Applying this ratio to the Falcon 9 full capacity figure of 22,800 kg, and rounding down to 20,000 kg, should be a reasonable estimate of the maximum payload on the recoverable version of the rocket, and close enough for the purposes here. The ratios for the Falcon Heavy and the Falcon 9 should be similar, as the first stage of the Falcon Heavy is essentially three first stages of the Falcon 9 strapped together (with the second stage the same in each), and the fuel that would be needed to be saved to allow for the recoveries and landings of the first stage boosters should be similar.
With this configuration where the Falcon Heavy is essentially three Falcon 9 first stage boosters strapped together, SpaceX was able to build an extremely large booster. It is currently by far the largest operational such vehicle in the US stable, and indeed is currently the largest in the world. The SLS will be larger if it becomes operational, but it is not at that point yet. By building on the Falcon 9, the development costs of the Falcon Heavy were relatively modest, although Elon Musk has noted it turned out to be more complicated than they had at first thought it would be. And with the three boosters that make up the first stage of Falcon Heavy similarly recoverable, one has even more spectacular videos of pairs of the boosters landing together back at the launch site (the third is recovered on a barge in mid-ocean). There is some penalty in the maximum payload weight that can be carried (about 10% as noted above), but the cost savings far exceed this (discussed below), leading to a cost per kilogram of payload that is almost a third less than when these first-stage boosters are not recovered.
The Atlas V and the Delta IV Heavy are both produced by the United Launch Alliance, the 50/50 joint venture of Boeing and Lockheed. Its creation in 2006 by bringing together into one company the sole two providers in the US at that time of large launch vehicles was questioned by many. The first launch of the Falcon 9 came only later, in 2010. But the primary customer was and is the US Department of Defense, and they approved it (and may indeed have encouraged it) as their primary concern was to preserve an assured ability to fly their payloads into orbit rather than the cost of doing so.
The Atlas series of vehicles were brought to the ULA from Lockheed (via a string of corporate mergers – the Atlas rocket was first developed by General Dynamics), and have a long history stretching back to the initial Mercury orbital launches (of Glenn in 1962) and indeed even before that. The models have of course changed completely over the years, and importantly since the year 2000 with the first launch of the Atlas III model which used Russian-made RD-180 engines. The RD-180 engines are now being phased out for national security reasons, but the planned follow on rocket (named the Vulcan, or more properly the Vulcan Centaur), has yet to fly. The Vulcan will use engines made by Blue Origin, and there have been delays in getting those engines delivered for the initial test flights.
There are ten different models of the Atlas V that have flown, and several more were available if a customer was interested. For the charts here, version #551 of the Atlas V has been used, as it has the heaviest lift capacity of the various versions and has flown at least ten times (as I write this in September 2021).
The Delta rocket also has a long history, with variants dating back to 1960. it was originally built by Douglas Aircraft, which after a merger became McDonnell-Douglas, which was later acquired by Boeing. Boeing then brought the Delta to the United Launch Alliance. There are also several variants of Delta rockets that have been available, but the Delta IV Heavy version will be used in the charts here as it can carry the heaviest payload among them. Until the first launch of the Falcon Heavy in 2018, the Delta IV Heavy had the greatest lift capacity of any rocket in the US stable. But as one can see in the chart, the payload capacity of the Falcon Heavy is double that of the Delta IV Heavy.
The Space Launch System (SLS) dates to 2011, when the basic design was announced by NASA. Key design requirements had been set, however, in congressional legislation drafted originally in the Senate and incorporated into the NASA Authorization Act of 2010 that was signed into law in October 2010. As was discussed above, NASA was instructed by Congress to develop the SLS and in doing so that it should use the rocket technology that had been developed for the Space Shuttle and which would have been used for the Ares V. The Space Shuttle technology dates from the 1970s with a first flight of the Shuttle in 1981. Its main rocket engines (three at the rear of the Orbiter) were the RS-25, which burns liquid hydrogen and oxygen. The Shuttle also had two solid rocket boosters attached, each of four segments.
The SLS design, following the mandates of Congress, uses four RS-25 engines in its core first stage. Two solid rocket boosters, of the same type also as used for the Shuttle, are attached on the sides (although with five segments each rather than the four for the Shuttle). The second stage of the SLS will use the RL-10 liquid-fueled engine – a design that dates to the 1950s and first flew in 1959. Indeed, for the initial (Block 1) model of the SLS, the second stage is in essence the second stage that has been used for some time on the Delta III and Delta IV boosters.
The SLS design shares many elements with the Ares V booster that would have been part of the Constellation program begun by the Bush administration. The first stage booster of the Ares V would have had five RS-25 rockets in its core (versus four of the RS-25s in the SLS) and also with two of the strap-on solid rocket boosters from the Shuttle (but with 5.5 segments each instead of the five on the SLS). While work on the Ares V never progressed far beyond its design, with NASA spending only $95 million on it before it was canceled, the SLS is very much based on the design of the Ares V and with similar ties to the Space Shuttle.
The engine technologies have of course evolved substantially over time, with upgrades and refinements as more was learned. And using existing designs should certainly have saved both time and money. But neither happened. Congress directed that the SLS should be operational by 2016, and early NASA plans were for it to be flying by 2017, but as of this writing it has yet to have had even a test flight. As noted previously, the first test launch is currently scheduled for November 2021, but many expect this will be further delayed. And as we will see below, despite the use of previously developed technology for most of the key components (in particular the rocket engines), the costs have been quite literally astronomical.
Finally, the Ares I booster is included here for comparison purposes. Its first stage would have been the same solid rocket booster used for the Space Shuttle (but just one booster rather than two, and of five segments), while the second stage would have used a version of the J-2 liquid-fueled engine. This engine was originally developed in the early 1960s for use in the upper stages of the Saturn 1B and Saturn V rockets then being developed for the Apollo program. There have been numerous upgrades since, of course, and some would say the J-2 version developed for the Ares I (named the J-2X) was close to a new design.
There was only one, partial, test flight of the Ares I before the program was canceled. That flight, in October 2009, was of the first stage only (the solid rocket booster derived from the Space Shuttle), with just dummies of the second stage and payload to simulate the flight dynamics of that profile. It reached a height (as planned) of less than 30 miles. While deemed a “success” by NASA, the launch caused substantial unanticipated damage to the launch pad, plus the parachutes designed to return the first stage partially failed.
As will be discussed below, while the Ares I never became operational, the amount spent on its (partial) development had already far exceeded that of comparable rockets. It was also facing substantial technical issues that could be catastrophic unless solved (including from excessive vibration and a concern that with its tall, thin, design it might drift into the launch tower on lift-off). Finally, as noted before, the rocket’s mission would be to ferry astronauts to the ISS, yet under the Bush administration’s plan to abandon and de-orbit the ISS by 2015 (in order to free up NASA funds for the Constellation program), the first operational flight (as forecast in 2009) would not be until 2016. Nonetheless, Obama’s decision to cancel the program was severely criticized.
C. The Cost of Developing the Rockets
In considering the costs of any vehicle, including rockets and spacecraft, one should distinguish between the cost of developing the technology and the cost of using it. Development costs are upfront and fixed, regardless of whether one then uses the rocket for one launch or many. Operational costs per launch are then a measure of what it would cost for an additional launch – what economists call the marginal cost.
While the concepts are clear, the distinction can be difficult to estimate. The costs may often be mixed, and one must then try to separate out what the costs of just the launches were from the cost of developing the system. But reasonable estimates are in general possible.
To start with development costs:

First, in the case of Ares I all the costs incurred were development costs as there were no operational launches. Figures on this are provided in the NASA budget documents for each fiscal year. A total of $4.6 billion was spent on the program between fiscal years 2005 (when the program was launched) and 2010 (when it was canceled).
But at that point the program was far from operational. The first operational flight was not going to be before 2016 at the earliest, and very likely later. To make the comparison similar to the costs of other rocket programs (which have reached operational status), one should add an estimate of what the additional costs would have been to reach that same point. But there is only a partial estimate of what those additional development costs would have been. As is standard, the FY2010 NASA budget had five-year cost forecasts (i.e. for the next four years following the request for the upcoming fiscal year) for each of the budget line items, and at that point the forecast was that the Ares I program would cost an additional $8.1 billion in fiscal years 2011 through 2014. Furthermore, this expected expense of over $2 billion per year would not be declining over time but in fact rising a bit, and would likely continue for several years more at a similar rate or higher until Ares I was operational.
Even leaving out what the additional development costs would have been beyond FY2014 (probably an additional $2 billion per year for several more years), the expected costs through FY2014 would have already been huge, at $12.7 billion. This is incredibly high for what should have been a relatively simple rocket (based on components that were already well used), although we will see similarly high costs in the development of the SLS. Why they are so high is difficult to understand, particularly as the Ares I is a booster whose first stage is simply one of the solid rocket boosters from the Shuttle program (and indeed initially physically taken from the excess stock of such boosters left over at the end of the Shuttle program, although modified with an extra segment added in the middle to bring it to five segments from four). And the second stage was to be built around an upgraded model of the old J-2 engine.
In sharp contrast to these costs for the Ares I, the development costs of the similarly sized Falcon 9 rocket as well as the far larger Falcon Heavy are tiny, at just $300 million and $500 million respectively. Are those figures plausible? Since SpaceX is not a publicly listed company, its financial statements are not published. However, it does have funders (both banks and others providing loans, as well as those taking a private equity position) so financial information is made available to them. While confidential, it often leaks out. Plus there are public statements that Elon Musk and others have made. And importantly, as a start-up founded in 2002, it was a small company without access to much in the way of funding in the period. They could not have spent billions.
One should acknowledge, however, as Elon Musk repeatedly has, that NASA provided financial assistance at a critical point. SpaceX, Tesla, and Elon Musk personally, were all running low on cash in 2006, were burning through it quickly, and would soon be out of funds. Then, in late 2006, NASA awarded SpaceX a $278 million contract under its new COTS (Commercial Orbital Transportation Services) program, to be disbursed as identified milestones were reached. SpaceX was among more than 20 competitors for funds under this program, with SpaceX and one other (Orbital Sciences, with its own launch vehicle and spacecraft) winning NASA support. The funding to SpaceX was later raised to $396 million (with additional milestones added) and was used to support the development of the Falcon 9 rocket, of the original version of the Dragon capsule to ferry cargo to the ISS, and the cost then to fly three demonstration flights (later collapsed to two) showing that the systems worked. The second (and final) demonstration mission was a fully successful launch in May 2012 of the Falcon 9 carrying the Dragon capsule with cargo for the ISS, which successfully docked with the ISS and later returned to earth. Following this, NASA has contracted with SpaceX for a series of cargo resupply missions to the ISS under follow-on contracts (under CRS, for Commercial Resupply Services) where it is paid for each successful mission. As of this writing, SpaceX is now at the 23rd flight under this program.
NASA funds were important. But they were only partial and not large, at less than $400 million to support the development of the Falcon 9, the Dragon capsule for cargo, and the initial demonstration flights. They are consistent with a cost of developing the Falcon 9 alone of about $300 million.
The specific figure of $300 million to develop the Falcon 9 comes from a statement Elon Musk made in May 2011 on SpaceX’s history to that point. He wrote that total SpaceX expenditures up to that point had been “less than $800 million”, with “just over $300 million” for the development of the Falcon 9. The rest was for the development of the Dragon spacecraft (used to deliver cargo to the ISS) for $300 million, the cost of developing and testing in five flights SpaceX’s initial rocket the Falcon 1 (which had a single Merlin engine newly developed by SpaceX – the Falcon 9 uses nine Merlin engines), the costs of building launch sites for the Falcon rockets at Cape Canaveral, Vandenberg, and Kwajalein in the Pacific, as well as the cost of building all the corporate manufacturing facilities for the Falcon rockets and the Dragon. Musk noted that the financial accounts are confirmed by external auditors, as they would be for any sizeable firm.
Separately, in 2017 a Senior Vice President of SpaceX (Tim Hughes), in testimony to Congress, noted that the development cost of Falcon 9 had been $300 million and $90 million for the earlier Falcon 1 rocket, and that NASA had independently verified these figures (in the report here, as updated).
The $300 million cost estimate looks plausible. Unlike NASA (as well as firms such as Boeing), as a new start-up SpaceX simply would not and did not have the funding to spend much more. But even if it were several times this, it would still be far less than what the cost of the similarly sized Ares I had been.
The estimate of $500 million to develop the Falcon Heavy also comes from statements made by Musk. It is also plausible. As noted above, the Falcon Heavy is basically a set of three Falcon 9 first-stage boosters strapped together, topped by a second stage (as well as payload fairing) that is the same as that on the Falcon 9. Musk has noted that it was not as easy to do develop the Falcon Heavy as they had initially expected (there are many complications, including the new aerodynamics of such a design), but even at $500 million the cost is a bargain compared to what NASA has spent to develop boosters.
The Space Launch System (SLS) has yet to fly. As noted before, this will take place no earlier than November 2021, but many expect there will be further delays. Furthermore, the plan is for only one test flight to be made. It is not clear what will happen if this test flight is not successful.
One has in NASA budget documents how much has been spent each year for the SLS thus far, and what is anticipated will be required for the next several years. A total of $26.3 billion will have been spent through FY2021 (i.e. to September 30, 2021). But the SLS is not yet operational, and the NASA budgets do not provide a breakdown between the cost of developing the SLS and the cost of launching it. And there is not a clear distinction between the two. Indeed, even the initial test flight has been labeled the Artemis 1 mission. It will not be manned, but it will carry the Orion spacecraft (also being tested) on a month-long flight that will take it to the moon, go into lunar orbit, and then leave lunar orbit to return to earth with a splashdown and recovery of the Orion.
If successful, the second launch of the SLS will not be until September 2023 at the earliest. While this flight would be manned and would loop around the Moon, some, at least, consider it also a test flight – testing all the systems under the conditions of a crew on board.
In part this is semantics, but treating the period until the end of FY2023 as the SLS still in the development phase, the total NASA is expected to have spent developing the SLS will be $32.4 billion. While its payload capacity is 50% larger than that of the Falcon Heavy, it would have cost 65 times as much to bring it to the point of being operational. While there are of course important differences, it is difficult to understand why the development of the SLS will have cost 65 times, and possibly more, than the cost of developing the Falcon Heavy. It is especially difficult to understand as the rocket engines (the main cost for a booster) of the SLS are models used on the Space Shuttle, the strap-on solid rockets are also from the Space Shuttle, and the RL10 engine used on the second stage is derived from that used on earlier US rockets, dating all the way back to the 1950s.
D. The Cost of Launching the Rockets
Once developed, there is a cost for each launch. One wants to know the pure marginal cost of an additional launch, excluding all of the development costs, as those costs are in the past and will be the same regardless of what is now done with the newly developed rocket (economists refer to those past costs as sunk costs).
In practice the costs can be difficult to separate. For private, commercial, vehicles, there may be some public information on what the firm providing the launch services is charging, but the price being charged for any specific flight is often treated as private and confidential, where the agreed upon price was reached through a negotiations process. And the price paid will presumably include some margin above the pure marginal costs to help cover (when summed across all the launches that will be done) the original cost of developing the rockets plus some amount for profits. It is even more difficult to determine for the SLS, as one only has what is published in the NASA budget documents for the amount being spent on the overall SLS program, where that total combines the cost of both developing and then launching the vehicle. NASA has not provided a break-down, and deliberately so. But one does have in the budget numbers a year-by-year breakdown, which one can use as the development costs (for the initial version of the SLS) will largely be incurred before the vehicle becomes operational, and the operational costs after. This will be used below.
Even with such provisoes, reasonable estimates of the costs are so hugely different that the basic message is clear:

SpaceX is most transparent on its costs. Standard prices are given on its corporate website, of $62 million for a Falcon 9 launch and $90 million for a Falcon Heavy. The site does not specify whether these are for the expendable or recoverable versions, but based on other information, it appears that the $62 million for the Falcon 9 reflects the cost of an expendable Falcon 9, while the $90 million for the Falcon Heavy is for the recoverable version. The $62 million for the Falcon 9 is similar to what was charged in the early years for the Falcon 9 before the ability to recover its first stage booster was developed. And Elon Musk has said that the cost of the fully expendable version of the Falcon Heavy maxes out at $150 million, which implies that the $90 million figure shown on its website is for the version where all three of the first stage boosters are recovered.
The $35 million figure for the cost of the Falcon 9 when its first stage is recovered is then an estimate based on a $62 million cost which is assumed to apply when the first stage cannot be recovered. In an interview in 2018, Musk said that the cost of the first stage booster is about 60% of the cost of a Falcon 9 launch, with 20% for the second stage, 10% for the payload fairing, and 10% for the operations of the launch itself. These are clearly rounded numbers, but based on them, 60% of $62 million is $37 million, with the remaining 40% then $25 million. Assuming, generously, that the cost to refurbish the booster for a new flight, plus some amortization cost (e.g. $3.7 million per flight if it can be reused for 10 flights), would be $10 million, then a cost per flight with recovered first stage boosters would be about $35 million per flight. This is broadly consistent with a statement made by Christopher Couluris (director of vehicle integration at SpaceX) in 2020 that SpaceX can bring down the cost per flight to “below $30 million per launch”, and that “[The rocket] costs $28 million to launch it, that’s with everything”. The $35 million figure for the recoverable version of the Falcon 9 might well be on the high side, but as was noted previously, I am deliberately erring on the high side for the cost estimates of SpaceX and on the low side for the NASA vehicles.
Thus a figure of $35 million per launch of a Falcon 9 with the first stage booster recovered is a reasonable (and likely high) figure for what the cost is to SpaceX for such a launch. The $62 million “list price” on the SpaceX website would then include what would be a generous (in relative terms) profit margin for SpaceX, covering the development costs and more. According to the SpaceX website, as I write this there have been 125 launches of the Falcon 9 since its first flight in 2010, on 85 of these they have recovered the first stage booster, and on 67 flights they have reflown a recovered booster. The first successful recovery of a first stage booster was in December 2015.
Competition matters, and following the more transparent prices being charged customers by SpaceX for the Falcon 9 and Falcon Heavy (at least transparent in terms of “list prices”), ULA in December 2016 set up a website called “RocketBuilder.com” where anyone can work out which model of the Atlas V they will need. There are ten models available, carrying payloads to low earth orbit from a low of 9,800 kg for the Atlas V model 401, up to 18,850 kg for the Atlas V model 551. As noted before, we are examining the model 551 here as its payload is closest to what the Falcon 9 can carry (22,800 kg in the expendable version and 20,000 kg in the recoverable version). The RocketBuilder.com website was “launched” with substantial publicity on December 1, 2016, accompanied by an announcement of substantial cuts in their prices for the Atlas V. The CEO of ULA, Tony Bruno, announced that prices for the Atlas V model 401 would start at $109 million – down from $191 million before. The price of the Atlas V model 551 would be $179 million when combined with a “full spectrum” of additional ULA services.
When set up, the RocketBuilder.com website included, importantly, what the list price would be of the Atlas V rocket model chosen. Unfortunately, the RocketBuilder.com website as currently posted does not show this. The reason might be that the CEO of ULA recently announced, on August 26, that ULA will take no more orders for flights of the Atlas V. The Atlas V uses the Russian-made RD-180 rocket engine (two for each booster), and for national security reasons ULA has been required to cease purchasing these engines. It must instead develop a new booster with key components all made in the US. The RD-180 is an excellent engine technically, and is also both highly reliable and relatively inexpensive. The decision to purchase it, from Russia, was made in the 1990s, and its first flight (on an Atlas III booster) was made in May 2000. But political conditions have changed, and the most important client for ULA is the US Defense Department.
ULA has now received its final shipment of six RD-180 engines from Russia, and there will be a further 29 Atlas V flights (of all models, not just the model 551) up to the mid-2020s, using up the stock of RD-180 engines ULA has accumulated. They have now all been booked. ULA now hopes to launch next year, in 2022, its first test flight of the rocket it has been developing to replace both the Atlas V series as well as the Delta IV Heavy, which it has named the Vulcan Centaur. It will use the new BE4 engines being developed by Blue Origin. But that first test flight has been repeatedly delayed. The first test flight was originally planned for 2019.
However, while the current RocketBuilder.com website of ULA no longer shows the cost to a customer of a launch of an Atlas V, one can find the former prices at an archived version of the RocektBuilder.com website. While these are prices from a few years ago, they do not appear to have changed (at least as list prices).
The selection is much like that of finding the list price of a new car by going to the manufacturer’s website, selecting the model, adding various options, and then additional services one might want. For the Atlas V, one can choose various levels of services, from a “Core” option to “Signature”, “Signature pro”, “Full Spectrum”, and “other customization”. These appear to relate mostly to the division of responsibilities between ULA and the customer on various aspects of integrating the payload with the rocket. ULA also offers two service packages it calls “Mission Insight” (things such as special access to ULA facilities) and “Rocket Marketing” (pre-launch events, press materials, videos, even “mission apparel”) that provide different levels of services and access. It is sort of like the higher levels of benefits granted by airlines to their frequent flyers, although here they charge an explicit price for the package.
On the archived website, selecting the payload capacity and orbit that will lead to an Atlas V model 551 being required, the base cost (in 2016) shows as $153 million (as I write this in September 2021). However, with a “Signature” level of service (which might be the base level required, as the “Core” option is not being allowed for some reason), the cost will be $163 million. And $173 million for the “Full Spectrum” package.
The website also prominently displays a line for “ULA Added Value” which is then subtracted from that cost. This does not reflect an actual price reduction by ULA, but rather savings that ULA claims the customer will benefit from if they choose an Atlas V launch by ULA. The base (default) value of these savings that ULA claims the customer will benefit from is $65 million. A breakdown shows this is made up of a claimed reduction in insurance costs of $12 million (what it otherwise would have been is not shown – just the “savings”), $23 million because ULA claims they will launch when it is scheduled to be launched and not several months later (which is more than a bit odd – one could produce whatever “savings” one wants by assuming some degree of delay in launch otherwise), and $30 million for what they call “orbit optimization”, which is a claim that the orbit they will place it in will lead to a lifetime for the satellite that is 17 rather than 15 years.
With such “savings” of $65 million (in a base case), ULA claims the actual cost for an Atlas V model 551 launch would not be $163 million, say (in the case considered above), but $65 million less, and thus only $98 million. While still more than 50% higher, this brings it closer to the Falcon 9 list price of $62 million. But this all looks like a marketing ploy – indeed rather like a juvenile charade – as that number depends on supposed savings from hypothetical levels. The amount paid to ULA would still be the $163 million in this example. And Elon Musk, among others, have questioned the assumptions.
The commonly cited $165 million cost of a launch of an Atlas V is therefore a reasonable estimate. One should, however, keep in mind that this is both a “list price” subject to negotiation and that depending on the specific options chosen, the price could easily vary by $10 or $20 million around this. The “savings” figures of ULA should not be taken too seriously, however. There will be specific factors affecting costs and possible savings with any given payload, for other rockets as well as the Atlas V, and comparisons to some hypothetical will depend on whatever is chosen for that hypothetical.
ULA has provided less public material on the cost of a Delta IV Heavy launch. This is in part as all of the customers, since the initial test flight in 2004, have been US government entities, and in particular the US Department of Defense. There have only been 12 launches since that initial test flight, with ten of these classified missions for the Defense Department and two for NASA. Furthermore, only three more are planned (two in 2022 and one in 2023), with ULA offering the planned Vulcan Centaur rocket (of which there will be a series of models that can carry progressively larger payloads, like for the Atlas V) as a substitute that can carry payloads of a similar size.
Both the Defense Department (especially) and NASA are less than fully transparent on what they have paid for these Delta IV Heavy launches. The specific costs of the launches can be buried in the broader costs of the overall programs. But the figures cited for a Delta IV heavy launch have typically been either $400 million (in a statement by ULA in 2015) or $350 million more recently. It may well have been that, under pressure from the far lower costs of SpaceX, ULA has reduced its price over time. For the purposes here, and erring on the side of being generous to ULA, I have used for the calculations a price of $350 million for a launch of an additional Delta IV Heavy.
The cost of an additional SLS launch is an estimated $2 billion, but there are conceptual as well as other issues with this figure. First of all, NASA refused to release to Congress, nor to anyone else for that matter, what the cost of an additional launch would be. Rather, one only had a single line item in the budget for the combined year-by-year cost of developing and testing the SLS, and also for building and then flying it. That cost reached $3.1 billion in FY2020, $3.1 billion also in FY2021 and again in FY2022, and with it then forecast to decline slowly but remain at $2.8 billion in FY2026. The SLS has not yet flown, and its first (uncrewed and the only planned) test flight is now scheduled for November 2021. The first operational flight (with a crew of four) would not be until 2023 at the earliest, with the second in 2024 at the earliest. The NASA plan is that there would then be one flight per year starting in 2026 and continuing on into the indefinite future.
But an estimate of the cost of an additional launch of the SLS leaked out, possibly due to an oversight but possibly not, in a letter sent to Congress in October 2019 from OMB. The letter addressed a range of budget issues for all agencies of the government, and set out the position of OMB and hence the administration on matters then being debated. One was on use of the SLS. Senator Richard Shelby of Alabama, who was then chair of the Senate Committee on Appropriations, had included in the language of the draft budget bill a requirement that NASA use the SLS for the launch of the planned NASA Europa Clipper mission (a satellite to Europa, a moon of Jupiter). In a paragraph on page 7 of the letter, OMB recommended against this, as there is “an estimated cost of over $2 billion per launch for the SLS once development is complete”. The letter noted that a commercial launch vehicle could be used instead for a far lower cost.
NASA later admitted (or at least would not deny) that this would be a reasonable estimate of the additional cost of such a launch. And it is consistent with the budget forecasts that the SLS program would continue to require funding of close to $3 billion each year once flights had begun (at a pace of one per year, or less). While the $3 billion is still greater than a figure of $2 billion per flight, the development costs for the SLS program will not end when the first SLS booster is operational. The initial SLS, while a sizeable rocket, would still not have the lifting capacity that would be needed (under current NASA plans) for the planned lunar landings following the very first.
Specifically, the initial model of the SLS (scheduled to be tested this November 2021) is labeled the Block 1, and has a lifting capacity of 95,000 kg to low earth orbit. The figures for the Block 1 are the ones that are being used in the charts in this post. However, its capacity would only be sufficient for the first three flights (including the test flight), where the third flight would support the first landing of a crew on the moon under the Artemis program. Following that, a higher capacity model, labeled the SLS Block 1B, would need to be developed, with a lifting capacity to low earth orbit of 105,000 kg. To achieve that, a new second stage would be developed using four of the RS-10 rocket engines (versus a second stage with just a single RS-10 engine in the Block 1 version).
Under current NASA plans the Block 1B version of the SLS would then be used only for four flights. For missions after that an even heavier lift version of the SLS would be needed, with two, more powerful, solid rocket boosters strapped on to the first stage (instead of the solid rocket boosters derived from those used on the Space Shuttle). These would increase the lifting capacity to 130,000 kg to low earth orbit. Part of the reason for developing the Block 2, with the new solid rocket side boosters, is that NASA will have used up by then its excess inventory of solid rocket booster segments (from the Space Shuttle program) for the planned launches of the Block 1 and Block 1B versions of the SLS (with one set in reserve). Using up the existing inventory makes sense. It should save money – although those savings are difficult to see given the expense of this program. But that inventory is limited and will suffice only for up to eight flights of the SLS. Hence the need for a replacement following that, which led to the design for the Block 2.
There will be development costs for the new second stage (with four RS-10 engines rather than one) for the Block 1B and then for the new, more powerful, strap-on solid rocket boosters for the Block 2. What share of the approximately $3 billion that would be spent each year for the development of these new models of the SLS has not been broken out in the NASA budget – at least not in what has been made public. But given that only very limited work has been done thus far on the new second stage for the Block 1B and even less on the new solid rocket boosters to be used for the Block 2, continuing development costs of $1 billion per year looks plausible.
At $2 billion per flight, the cost of a SLS launch is huge. And this does not include any amortization to cover the development costs. As noted above, those costs are expected to reach over $32 billion by FY2023. The costs per launch for the other rockets shown on the chart, including the Falcon Heavy, will include in the prices charged some margin to cover the original development costs. Commercial companies must do this to recover the costs of their investments. That amount would be gigantic if added for the SLS in order to make its cost figure more comparable to that of the alternatives.
The question is how many flights of the SLS there will be before a more cost-effective alternative starts to be used. Note that the alternative need not be limited to another giant rocket with a similar lift capacity. The SLS itself will not be large enough to carry in a single launch all that will be required on the Artemis missions to the moon. Rather, there would be separate launches on a range of boosters to carry what would be required. Indeed, a NASA plan developed in 2019 for the launches that will be necessary through to 2028 as part of the Artemis missions to the Moon envisaged 37 separate launches, of which only 8 would be of the SLS (including its initial test launch). One can break up the cargoes in many different ways.
While speculative, and really only for the point of illustration, one might assume that there will be perhaps 10 flights of the SLS before more cost-effective alternatives are pursued. If so, then to cover the over $32 billion development cost one would need to add over $3 billion per flight to make the figures comparable to the costs of the other, commercial, launchers. That is, the cost would then be over $5 billion per flight for the SLS rather than $2 billion. This would, however, now be more of an average cost per flight than a true marginal cost, and speculative as we do not know how many flights of the SLS there will ultimately be (other than that it will not likely be many, given its huge cost). Hence I have kept to the $2 billion figure, which is already plenty high.
Even at $2 billion per flight for the SLS, the cost is over 13 times the cost of a Falcon Heavy (in the version where the boosters are all thrown into the ocean rather than recovered). The lift capacity of the SLS is 50% more, but it is difficult to imagine that that extra capacity could only be achieved at a cost (even ignoring the huge development cost) that is more than 13 times as much.
What has happened on the Europa Clipper mission provides a useful lesson. Following a review and consultations with Congress, the Biden administration on July 23, 2021, announced that the Europa Clipper would be flown on a Falcon Heavy instead of the SLS. The total contract amount with SpaceX for all the launch services is just $178 million (which will include the special costs of this unique mission). There were several reasons to make the change, in addition to the savings from a cost of $178 million rather than $2 billion. One is simply that by using the Falcon Heavy they will be able to launch in October 2024. No SLS will be available by that time, nor indeed for several years after. While a more direct route to Jupiter would have been possible with the heavier lift capacity of the SLS, the Europa Clipper would have had to be kept in storage for several years until a SLS rocket became available. Separately, NASA discovered there would be a severe vibration issue due to the solid rocket boosters on the SLS, which the delicate spacecraft would have not have been able to handle. To modify the Europa Clipper to make it able to handle those vibrations would have cost an additional $1 billion.
Finally, it is clear that the politics has changed. Senator Shelby of Alabama has been the figure most insistent on requiring use of the SLS to launch the Europa Clipper. With the NASA Marshall Space Flight Center (located in Huntsville, Alabama) the lead NASA office responsible for the SLS, a significant share of what is being spent on the SLS is being spent in Alabama. And as Chair of the Senate Committee on Appropriations, Senator Shelby was in a powerful position to determine what the NASA budget would be. But as a Republican, Senator Shelby lost the chairmanship when the Senate came under Democratic control in January 2021, plus he has announced he will not run for re-election in 2022. His influence now is thus not what it was before, and NASA can now pursue a more rational course on the launch vehicle.
E. The Cost of Developing and Operating Spacecraft for Crews
NASA has also used its new, more commercial, contracting approach for the development and then use of private spacecraft to carry crew to the ISS. This was indeed the proposal of President Obama in 2010 that was so harshly criticized, as discussed at the beginning of this post. We now know how that has worked out: SpaceX is flying crews to the ISS routinely, while Boeing, a traditional aerospace giant which was supposed to be the safe choice, has had issues. We also can compare the costs under this program (for both SpaceX and Boeing) to that of developing the Orion spacecraft, where Lockheed Martin is the prime contractor operating under the more traditional NASA contracting approach.
There are, of course, important differences between the Orion and the spacecraft developed by SpaceX (its Crew Dragon, sometimes referred to as the Crew variant of the Dragon 2 as the capsule is a model derived from the original Dragon capsule used for ferrying cargo to the ISS), and by Boeing (which it calls the CST-100 Starliner, or just Starliner for short). The SpaceX Crew Dragon and the Boeing Starliner will both be used to ferry astronauts to the ISS in low earth orbit, while the Orion is designed to carry astronauts to the Moon and possibly beyond.
But there are important similarities. They are all capsules, use heat shields for re-entry, and can seat up to six astronauts (Orion) or seven (Crew Dragon and Starliner), even though NASA plans so far have always been for flights of just four astronauts each time. They are all, in principle, reusable spacecraft. The interior volume (habitable space for the astronauts) is 9 cubic meters on Orion, 9.3 cubic meters on Crew Dragon, and 11 cubic meters on Starliner.
Orion will also be launched with a Service Model attached, which is being built by Airbus under contract to the European Space Agency. This Service Module will have the fuel and engines required to help send Orion from earth orbit to the moon, and then fully into lunar orbit and back, as well as power (from solar panels) and supplies of certain consumable items required for longer space flight durations. With this, Orion will be able to undertake missions of up to 21 days. The self-contained Crew Dragon can carry out missions of up to 10 days, while the Starliner has the capacity of just 2 1/2 days – providing time to reach the ISS and later return, but not much else.
The cost of developing and building the European Service Module for Orion is being covered by the European Space Agency as its contribution to the program. For better comparability to the Crew Dragon and Starliner spacecraft, the costs of the Service Module for Orion have been excluded from the cost of Orion in the charts below, as it is primarily the Service Module that will give the Orion the capabilities to go beyond earth orbit – capabilities that the Crew Dragon and Starliner do not have. Had the costs of the Service Module been included (as the Orion is, after all, dependant on it), the disparity in costs between it and the Crew Dragon or Starliner would have been even larger.
The development of Orion began in 2004, as part of the Constellation program of the Bush administration, and has continued ever since. NASA spent $1.4 billion on it in FY2020, again in FY2021, and the budget proposal is to do so again in FY2022. Aside from an uncrewed flight in 2014 that was principally to test its heat shield design, the Orion has yet to fly. Its first real test, still unmanned, will be as part of the first test flight of the SLS, which as noted above is now scheduled for November 2021.
SpaceX and Boeing were awarded the new form of competitive contracts by NASA to build their new spacecraft, demonstrate that they work (with a successful unmanned test flight to the ISS and then a manned flight test), and then fly them on six regular missions carrying NASA astronauts to the ISS. The designs were by the companies – NASA was only interested in safe and successful flights ferrying crew to the ISS.
Each contractor could use whatever booster they preferred (SpaceX chose the Falcon 9 and Boeing the Atlas V), with the costs of those rocket launches included in the contracts. The contract awards were announced in September 2014, several years later than the Obama administration had initially proposed due to lack of congressional funding. The original contracts provided awards of up to $4.2 billion to Boeing and $2.6 billion to SpaceX, a discrepancy that reflected not that SpaceX would provide a lesser service, but rather that SpaceX offered in their contract bid a lower price. Boeing was later granted an extra $287.2 million by NASA, in a decision that was criticized by the Office of the Inspector General of NASA, as Boeing (as well as SpaceX) had committed to provide the services agreed to under the contracts for the fixed, agreed upon, price. Any cost overruns should then have been the responsibility of the contractor. While Boeing argued it was not really a cost overrun under their contract, others (including the NASA Inspector General) disagreed.
Before the main contracts under the program had been approved, Boeing and SpaceX (along with others) had received smaller contracts to develop their proposals as well as to develop certain technologies that would be needed. Including those earlier contracts (as well as the extra $287.2 million for Boeing), the total NASA would pay (provided milestones are reached) is $5,108.0 million to Boeing and $3,144.6 million to SpaceX. For this, each contract provided that the new spacecraft would be developed and tested, with this then followed by six crewed flights of each to the ISS. Thus the contracts include a combination of development and operational costs, which will be separated in the discussion below.
First, the development costs:
 The estimates of the development costs for the SpaceX Crew Dragon and Boeing Starliner were made by subtracting, from the overall program costs, estimates made in the November 2019 report of the NASA Inspector General’s Office of the costs of the operational (flight) portions of the contracts. Included in the development costs are the costs of the earlier contracts with SpaceX and Boeing to develop their proposals, as well as the extra $287.1 million that was later provided to Boeing. Based on this, the total cost (to NASA) of supporting the development of the SpaceX Crew Dragon has been $1.845 billion, while the cost to NASA of the Boeing Starliner (assuming Boeing is ultimately successful in getting it to work properly) will be a bit over $3.0 billion.
The costs assume that the contractors will carry out their contractual commitments in full. SpaceX so far has (the Crew Dragon is fully operational, and indeed SpaceX is now in its second operational flight, with a crew of four now at the ISS who are scheduled to return in November). But Boeing has not. As noted before, its initial unmanned test flight in December 2019 of the Boeing Starliner failed. The planned re-try was on the pad in late July of this year and expected to fly within days when problems with stuck valves were discovered. The Starliner had to be taken down and moved to a facility to identify the cause of the problem and fix it, with the flight not now expected until late this year at the earliest. The extra costs are being borne by Boeing and have not been revealed, but in principle should be added to the $3,008 million cost figure in the chart above. But they have been kept confidential, so we do not know what that addition would be.
In contrast to the cost to NASA of $1.845 billion for the SpaceX Crew Dragon and $3.0 billion to Boeing for its Starliner (under the new, competition-based, contractual approach), the amount NASA has spent on the Lockheed Orion spacecraft (under its traditional contractual approach) has been far higher. More than $19.0 billion has already been spent through FY2021, and Orion is still in development. Other than the early and partial test in 2014, the Orion has yet to be fully tested in flight. The first such test is currently scheduled, along with the first test of the SLS, for later this year. At best, it will not be operational until 2023, although more likely later. Just adding what is anticipated will be needed to continue the development of Orion through FY2023, the total that NASA will spend on it will have reached $21.8 billion. But the FY2023 cut-off date is in part arbitrary. While the Orion capsule should be flying by then, there will still be additional expenditures to finalize its design and for further development. These would add to the overall cost, but we do not know what those are expected to be.
Including costs just through FY2023, the cost of developing Orion is already close to 12 times what it has cost to develop the SpaceX Crew Dragon, and over 7 times what it has cost NASA to develop the Boeing Starliner. While there are of course differences between the spacecraft, and it may be argued that the Orion is more capable, it is hard to see that such differences account for a cost that is 12 times that of the SpaceX Crew Dragon, or even 7 times the cost of the Boeing Starliner. And as noted above, the greater capabilities of the Orion derive primarily from the European Service Module, whose costs are not included in the $21.8 billion figure for Orion.
The operational costs of the Orion will also be higher, using for comparability what it would be for a flight to earth orbit. The most relevant figure is the cost per seat, and the calculations assume four seats will be filled on each flight (as NASA in fact plans, for both the missions to take astronauts to the ISS as well as for the Orion missions):

The costs include not only the cost of using the spacecraft itself, but also, and importantly, the cost of the rocket used to launch the spacecraft into orbit. The costs of the rockets were included in the NASA contracts with SpaceX and Boeing, as the contracts were for the delivery of crews to the ISS.
The per-seat costs for the SpaceX Crew Dragon and Boeing Starliner contracts were calculated following the approach the NASA Inspector General used in its November 2019 report, using its estimate of the operational portion of the contracts with SpaceX and Boeing. They come to $54.2 million per seat on the SpaceX Crew Dragon and $87.5 million on the Boeing Starliner (before rounding – in the Inspector General’s report one will see rounded figures of $55 million and $90 million, respectively).
The costs of building a new Orion capsule (which can then be reused to some degree) and flying it can be estimated from the announced NASA contracts with Lockheed for future missions. In September 2019, NASA announced that it had awarded Lockheed an “Orion Production and Operations Contract”, where NASA would pay Lockheed for the Orion spacecraft for use on planned Artemis missions, but where the Orion spacecraft themselves would be reused to a varying degree that will rise over time. The contracts for the Orions to be used in the first two flights (Artemis I and II) were signed some time before, and one can view these as part of the development costs (as these will be missions testing the Orion capsules). The September 2019 announcement was that Lockheed would be paid a total of $2.7 billion for the next three missions (Artemis III, IV, and V), with re-use started to a limited degree. Some high-value electronics, primarily, from the Orion used on the Artemis II mission would be re-used in the capsule for Artemis V. Future costs would then fall further with greater re-use, but this should still be seen as speculative at this point.
Based on the $2.7 billion figure for the three Artemis missions following the first two, and with four seats on each of those three flights, the per-seat cost for the Orion alone would be $225 million. To this one would need to add, for comparability, the cost of the rocket launcher. The Artemis missions would use the SLS, which as discussed above, will cost $2.0 billion per flight. This would add $500 million per seat (with the four seats per flight), bringing the total to $725 million per seat.
While that is indeed what the cost would be for the lunar missions, it is not an appropriate comparator to the costs of the Crew Dragon and Spaceliner capsules as the rockets they need are just for earth orbit. For this reason, for the figure in the chart I have used the per-seat cost of what a launch on an Atlas V would be. The Atlas V is the vehicle that will be used for the Boeing Starliner, and it has a comparable weight to the Orion (excluding the Orion European Service Module). That per-seat cost, for a launch to earth orbit, would be $266.25 million.
Based on these figures, the operational cost per seat of an Orion capsule is almost 5 times what the per-seat cost is for the SpaceX Crew Dragon, and 3 times the cost on a Boeing Starliner. These are huge differences.
F. Conclusion
There was vehement opposition to Obama’s proposal to follow a more commercial approach to ferry crew to the ISS. This came not only from former astronauts – who as pilots and engineers were taking a position on an issue they really did not know much about, but who were comfortable with the traditional approach. Of more immediate importance, it came from certain politicians – in particular in the Senate. The politicians opposed to the Obama proposals, led by Senator Shelby of Alabama, were also mostly (although not entirely) conservative Republican politicians who on other issues claimed to be in favor of free-market approaches. Yet not here.
We now know that SpaceX delivered on the contracts, with now routine delivery of both cargo and crew to the ISS. Indeed, as I complete this post, an all-private crew of four have just returned from a three-day flight to earth orbit on a SpaceX Crew Dragon spacecraft (launched on a Falcon 9). The flight was a complete success, and showed that flights of people to orbit are no longer restricted to a very small number of large nation-states (specifically Russia, the US, and China). NASA certainly played an important role in supporting the development of the Falcon 9 and the Crew Dragon, as discussed above, but these flights are now private. If Senator Shelby and his (mostly) Republican colleagues had gotten their way, this never would have happened. The hope that this would follow was, however, an explicit part of the plan when the Obama administration proposed that NASA contract with private providers to bring crew to the ISS. And it has.
Boeing is not yet at the point that SpaceX has reached, with its Starliner capsule still to be proven, but it appears likely that they will have worked through their problems by sometime next year (approximately three years after SpaceX succeeded with its first tests). Meanwhile, even though work on the Orion spacecraft began in 2005 and work on the SLS began in 2011, both the SLS and Orion are still to be tested. The SLS was supposed to be operational in 2016, but its first operational flight is now scheduled for 2023 and will almost certainly be later. The key components of the SLS (the engines and the strap-on solid rocket boosters) were all taken from the Space Shuttle or even earlier designs. It is not at all clear why this should have taken so long.
We also can now work out reasonable estimates of the costs, and can compare them to the costs under the more commercial approach. In terms of the development costs (planned through FY2023), the SLS will cost an astonishing 65 times what it cost to develop the Falcon Heavy. The SLS will be able to carry a heavier load, but only about 50% more than what a Falcon Heavy can carry. It is difficult to see why this would cost 65 times as much. And it is not just the SLS. The cost of developing the Ares I, including what had been planned to be spent through FY2014 (when it still would not have been fully ready) would have been 42 times what the similarly sized Falcon 9 cost to develop. These are mind-boggling high multiples.
The operational costs per launch are also high multiples of what the costs are for commercially developed rockets. The cost of a launch of the SLS will be 22 times the cost of the recoverable Falcon Heavy. While it can carry more, the cost per kilogram to low earth orbit will be 13 times higher for the SLS (excluding its development costs) compared to that for the recoverable version of the Falcon Heavy, and 9 times higher when compared to the expendable version.
Similarly, it is expected that development of the Orion capsule (not counting the cost of the Service Module, that the Europeans are developing as their contribution to the program) will by FY2023 have cost almost 12 times the cost of developing the SpaceX Crew Dragon. And the operational cost per seat will be 5 times higher for the Orion than the cost for the Crew Dragon flights, and 3 times higher than for the Boeing Starliner.
The evidence is clear. Why then, are the conservative Republican Senators and Members of Congress (as well as a few Democrats, including, significantly, Representative Eddie Bernice Johson, D-Texas, who is the current Chair of the House Committee on Science, Space, and Technology) so opposed to NASA entering into commercial contracts with SpaceX and others? The answer, clearly, is the politics of it. Spending billions of dollars on such hardware keeps many employed, and many of those jobs are in high-wage engineering and technical positions. From this perspective, the high costs are not a flaw but a feature.
This is not only a waste. Since budgets are not unlimited such waste has also meant long delays in achieving the intended goals. The space program has traditionally enjoyed much goodwill in the general population. But such waste, as well as the resulting long delays in achieving the intended aims, could destroy that goodwill.
That would be unfortunate, although not the end of the world. One does, however, see the same issues with the military budget, where the stakes are higher. And the costs are also much higher, with major military programs now costing in the hundreds of billions of dollars rather than the tens of billions for the space program. An example has been the development of the F-35 fighter jet. The program began in 1992, the first prototypes (of Lockheed and Boeing) flew in 2000, Lockheed won the contract in 2001, the first planes were manufactured in 2011, and the first squadron became operational in 2015. That is, it took 23 years to go from the initial design and conceptual work to the first operational unit. Furthermore, it is expected to be the most expensive military program in history, with over $400 billion expected to be spent to acquire the planes and a further $1.1 trillion to keep them operational over a 50-year life cycle for the program. That is a total cost of $1.5 trillion, and other estimates place the cost at $1.6 or even $1.7 trillion (and no one will know for sure what it will be until this is all history).
The factors driving such high costs as well multi-decade time frames to go from concept to operations are undoubtedly similar to those that have driven this for major NASA programs such as the Orion and the SLS. Spending more is politically attractive to those politicians that represent the states and districts where the spending will be done. But for the military, the stakes (and not simply the dollar amounts) are a good deal higher than they are for the space program.
But it should also be recognized that the cure for this is likely to be more complicated and difficult than what NASA has been able to achieve through changes to its traditional contracting and procurement model. Industry capabilities will need to be developed, with greater competition introduced. In major areas there are now often only two or three manufacturers, and sometimes only one, with the capabilities required.
We do, however, now have examples of what can be done. ULA (United Launch Alliance) had a monopoly on heavy-lift launch vehicles following its creation in 2006 by combining what had been the competing launch divisions of Boeing and Lockheed. SpaceX entered that market, and we saw above what resulted. If such progress is possible with something as complex as a heavy-lift rocket, it should be possible in at least some other areas of military procurement as well.
=======================================================
Annex: Why Cost Comparisons of Rockets and Spacecraft are Difficult to Make
One might think that comparisons of costs of rockets as well as spacecraft would be straightforward. But they are not, for a number of reasons:
a) First, different sources will often provide different estimates. There is no single, authoritative, source that one can cite, and one will often see differing estimates in different sources. Recognizing this, for the purposes here – which are to compare the costs where there is competition (primarily SpaceX) to the costs under NASA procurement from the traditional contractors – I have sought to use estimates that are on the high side of what has been published for the costs of the SpaceX vehicles, and on the low side for the costs of the traditional NASA contractors. Despite this, the SpaceX costs are still far lower.
b) An important reason there are these different cost estimates from different sources is that the information on what the costs actually are have often been kept confidential. SpaceX is the most transparent, but even here what they publish on their website ($62 million for a Falcon 9 launch, and $90 million for a Falcon Heavy) should really be viewed more as a “list price” that will be negotiated. For NASA, full transparency on the costs can be embarrassing. For commercial providers, less-than-transparent cost figures may be seen as helpful when they engage in negotiations with those who would purchase their services.
c) Which brings us to a third factor, which is negotiating power. Just like when buying a car, the price that will be paid will depend in part on the relative negotiating powers of the parties. When there is a low-cost competing supplier (such as SpaceX), there will be pressure on higher-cost suppliers to lower their prices. One has seen this with the prices being charged for launches of the Delta IV Heavy and Atlas V rockets. Negotiating power will also depend on whether one will be a repeat customer or just a one-time user. For these reasons there will not be one, unique, price that can be cited as the “cost” of launching a particular rocket. It will depend on the negotiations.
d) And this also leads to the distinction between the cost of a rocket launch and the price charged. Ideally, what one wants as the basis for comparison is the cost. However, the best information available will often be the price that some customer paid. But that price may include a substantial profit margin if that customer did not have much negotiating power to bargain down the price. It might also work the other way. The cost of developing and launching the Boeing Starliner capsule, which was discussed above, is based on what NASA is paying. Yet because of the repeated problems with the development of the Starliner, Boeing is certainly losing money on that fixed-price contract. How much Boeing is losing has not been disclosed, and indeed since there are continued problems they do not yet know themselves how much it will have cost in the end. Hence, in a comparison of the cost of delivering astronauts to the ISS the true cost of the Boeing Starliner will be something more than what NASA is paying, and it is that higher cost which really should be the basis for comparison with the cost of the SpaceX Crew Dragon alternative.
e) The common basis for comparison is also inherently problematic. While the standard measure for a rocket (and the one used here) is how many kilograms of payload can be lifted to low earth orbit, specific situations are more complicated. Depending on the mission, one will want to place the payload into different types of orbits, including different altitudes (from 100 miles to several hundred miles, and still be considered “low”), different angles to the equator (the higher the angle, the higher the share of the world’s land area that would be covered by the satellite over some period, such as a month), and perhaps different requirements on how circular the orbit needs to be (the difference between the highest point in the orbit and the lowest). There will be different thrust (hence fuel) requirements for each of these, possibly different payload weights that can be handled, and possibly other differences, all of which would end up being reflected in the negotiated price for the launch.
f) Different payloads also have different requirements on how they must be handled, how they need to be attached to the rocket, the requirements on the fairings (the nose cone shell surrounding the payload to protect it at launch, which is jettisoned once orbital altitude is reached), and so on. Military launches are also more expensive (and charged accordingly) due to the secrecy arrangements the Defense Department requires.
g) Different boosters will also have different capabilities. For a launch into low earth orbit these capabilities might not all be needed, but they may still be reflected in the costs. The most obvious is the size of the payload. If the weight is more than a smaller rocket can handle (and the payload cannot be divided into two or more smaller satellites), then they will have to use a larger booster even if the cost per kilogram is higher.
h) The calculations of the cost per kilogram of payload are also based on the maximum payload each rocket can handle. But it would be coincidental that any particular payload will be exactly at this maximum weight. The cost per kilogram will then be higher for a payload that weighs less than this maximum. While there may be some savings in total costs in launching a payload that is less than the maximum a rocket can handle (somewhat less fuel will be needed, for example), such savings will be modest. For this reason, SpaceX and others will typically offer to sell, at a low price, such extra space to those with just small satellites, piggy-backing on larger satellites that do not need to use up the full payload capacity of the rocket. The entity with the larger satellite might then receive a discount from what the cost otherwise would have been.
i) Finally, one should recognize that there are normally several variants of each launch vehicle, with somewhat different capabilities and costs. To the extent possible, all the cost estimates in this post are for a single, recent, variant of the vehicles. The Falcon 9 launch vehicle, for example, is now at what they have named the “Block 5” variant, and the costs of that version are what have been used here. Earlier versions of the Falcon 9 were labeled v1.0, v1.1, v1.2 or “Full Thrust” (and sometimes referred to as Block 3), and Block 4.
There are therefore a number of reasons why one needs to be cautious in judging reported cost differences between various rockets as well as spacecraft. As noted in the text, cost differences of 10 or 20% certainly, and indeed even 40 or 50%, should not be seen as necessarily significant. But as the charts show, the cost differences are far higher than this, with the costs of the traditional contractors following the traditional NASA procurement processes many times the costs obtained under the more competitive process the Obama administration introduced to manned space flight (at substantial political cost).


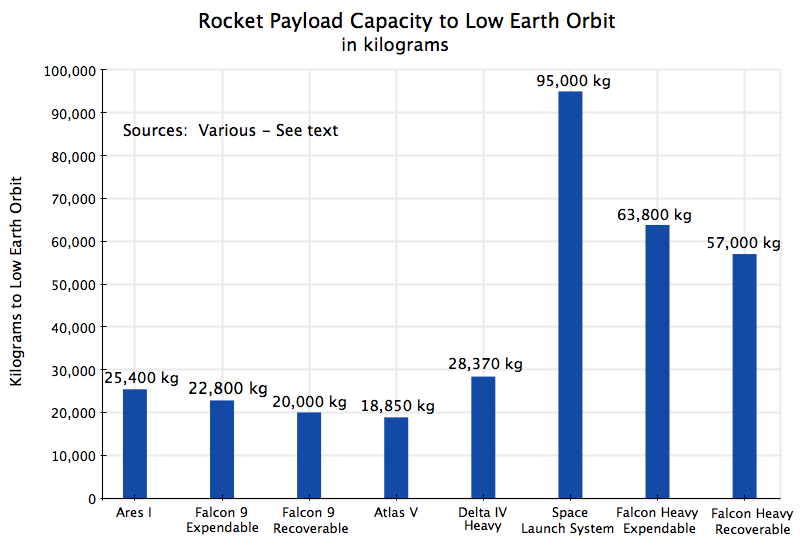
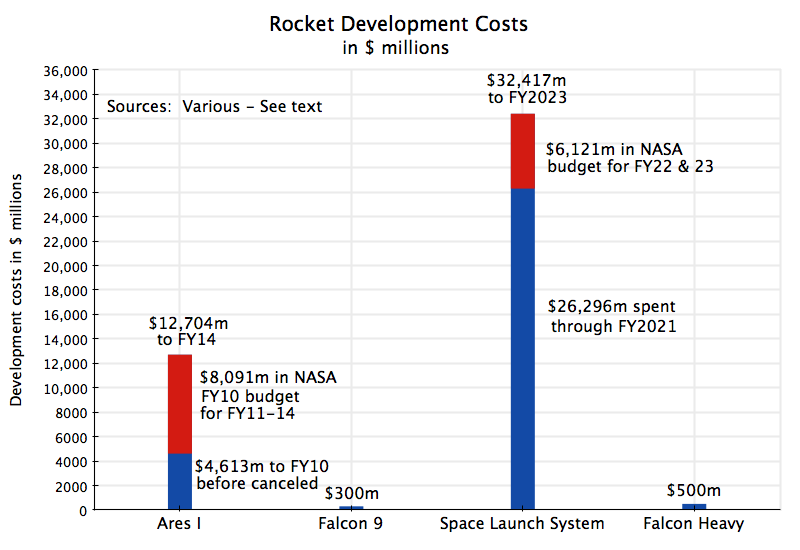


You must be logged in to post a comment.