
The Impact of Health Reform on Jobs: The Evidence from Massachusetts is Positive

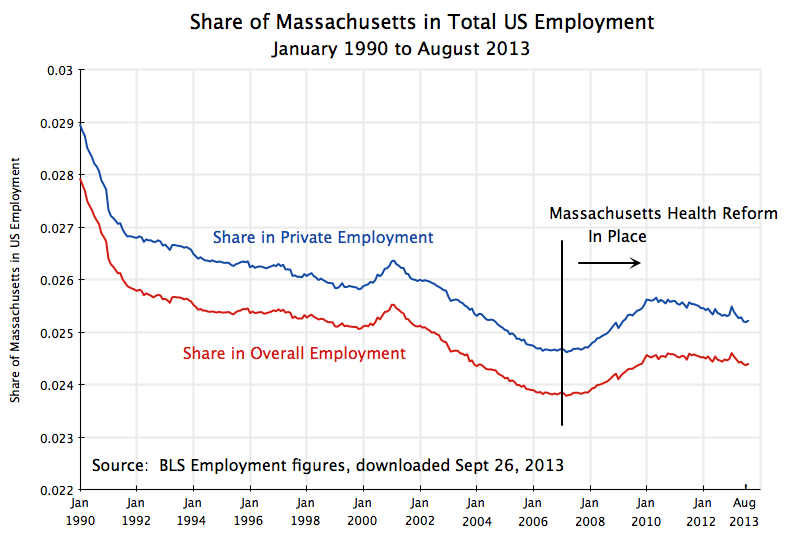
Share of Massachusetts in US Employment, Jan 1990 to Aug 2013

A.  The Assertion

Republicans have repeatedly asserted that the Affordable Care Act signed into law in 2010 (also often referred to as ObamaCare) will be, and indeed already has been, a “job-killer”.  The Republican controlled Congress has voted repeatedly to repeal the health reform, starting once they took control of the chamber in January 2011 (with the first such bill titled “Repealing the Job Killing Health Care Law Act”), and with over 40  such party-line votes since then.

But while the Republicans have vociferously asserted that the health care reform law has and will “kill jobs”, is there any evidence that such a law will indeed do this?  The assertion is particularly odd as the major reform under the law, that of establishing competitive market exchanges through which the currently uninsured will be able to purchase affordable health coverage from private insurers, has not even gone into effect yet.  The exchanges are scheduled to open only on October 1, and coverage will not begin for policies purchased on the exchanges until January 1, 2014.

Once the law goes fully into effect, we may be able to find from the data whether the impact of the health reform law had a negative, or a positive, impact on jobs.  But until then we can look at the impact a very similar reform that may shed light on what to expect.

Specifically, what has come to be called “ObamaCare” was modeled on a very similar health reform passed in Massachusetts in 2006.  That reform was signed into law by then Governor Mitt Romney on April 12, 2006, and entered into implementation in phases starting in late 2006.  The poor were first enrolled into a subsidized health insurance program, and then competitive market exchanges for health insurance for other individuals opened on May 1, 2007.  An individual mandate to have insurance from some source began on July 1, 2007.  If this health care reform is a job killer, one would expect to find that job growth in Massachusetts from 2007 and for the next several years to be relatively slower than job growth in the rest of the US.  The share of Massachusetts in total US jobs would then fall.  Did that happen?

B.  The Evidence

The graph at the top of this post shows employment in Massachusetts (using BLS data) as a share of employment in all of the US from 1990 (when the series on state employment starts) to now, including the period before and after 2007.  The Massachusetts shares of overall employment (including government) as well as private employment only, are shown.  (The private employment share is higher than the overall employment share since the share of government employment in Massachusetts is relatively less than it is elsewhere in the country, despite what some people appear to assume).

The trend from 1990 up to 2007 was for the share of Massachusetts in national employment to fall.  Massachusetts is a relatively small and mature state, and employment in the US in the period was focused more on the Sun Belt states.  But it is then striking how this turned around precisely in 2007, as the Massachusetts Health Care reform entered into effect.  If such a health reform had been a “job-killer”, then the Massachusetts share in national employment would have fallen in 2007 and the following years.  One would at least have seen a continuation of the previous downward trend.  But instead the share turns sharply up starting in 2007, with this continuing to about 2010/2011 before it levels off and then perhaps resumes the previous trend.

One should of course not put too much weight on this one observation.  There was much else going on in the economy at that time, which might account for why job performance in Massachusetts was relatively better than elsewhere in the US in 2007 and subsequent years.  In particular, the economy collapsed in 2008, in the last year of the Bush Administration, pushing up national unemployment in 2008 and 2009 until the stimulus program of the new Obama Administration plus aggressive Fed actions turned this around.  The 2008 collapse could have differentially affected Massachusetts.  However, the change in the trend in Massachusetts began before national unemployment started to rise.

Furthermore, while one sees also a similar (but much smaller) peak in the graph starting with a rise from the beginning of 2000 and then a fall in 2001, this rise and fall did not coincide with the increase in unemployment during the first few years of the Bush Administration.  National unemployment started to rise only in January 2001, and then reached a peak in June 2003.  Finally, from 1990 to June 1992 there was also a rise in national unemployment, during the Bush I Administration, but this coincided with a steady fall of the share of Massachusetts in total national employment over the period.  This was the opposite of the pattern seen in 2007 to 2010.  There does not appear to be a consistent pattern that the Massachusetts share of US employment rises in recessions, so one would need to be careful to argue that this must explain what happened in 2007-10.

C.  Conclusion

The rise in the share of employment in Massachusetts in overall US employment following the implementation of the Massachusetts Health Reform in 2007 is therefore consistent with the view that such reforms are not job-killers.  Following the implementation of the health reform, job growth in Massachusetts was relatively faster (or job cuts were relatively slower, during the peak of the downturn) than elsewhere in the US, with this lasting for several years.  While too much should not be read into this finding and assume that it implies health reform will spur a sharp increase in jobs, it is certainly not consistent with the assertion made by the Republicans that such health reform will necessarily be a dramatic killer of jobs.

A Disappointing March Jobs Report

Employment, Monthly Change, Dec 2005 - March 2013

The Bureau of Labor Statistics released this morning its regular monthly report on employment.  Growth in jobs in March was disappointingly low, at just 88,000 net new jobs created.  The expectation among analysts (averaging across all their forecasts) prior to the report coming out was that 193,000 net new jobs had been created in March.  Private sector job growth in the BLS figures was just 95,000, while government once again brought down job growth with a cut of 7,000 public sector jobs.  While one should not read too much in one month’s report, and it follows a fairly good February report, the slow-down in March appears to indicate that the recent signs of improvement (including that February jobs report) are being undermined by the decisions being made in Washington on government spending.

The worst of the government cut-backs are yet to come.  The sequester, under which $85 billion in spending authority in the remainder of fiscal year 2013 has been cut (roughly 1% of GDP over this seven month period), only entered into effect on March 1.  It appears that most of the cuts will be enforced through mandatory furloughs, where government workers will be forced not to come to work for a certain number of days (varying by agency) and then not be paid for those days.  These furloughs will only start in April, as a 30 day notice is required.  The furloughed workers will not show up directly in the unemployment statistics, but with their resulting lower incomes (about 5% on average it appears) they will have less to spend in this still weak economy, thus depressing demand and private jobs.  We will see how this works out over the coming months.

There are in fact some early signs of the sequester having an adverse impact on the private sector.  For example, in the past week, both Delta Air Lines and then US Airways announced that their March revenues were weak, which they attributed at least in part to the sequester (leading not only to less travel by government workers, but also and more importantly, less travel by government contractors).  But it is still early.  And since the impact on the GDP numbers will not become significant until the second quarter, we will not know until July (when the initial GDP estimate is published) what the impact on GDP growth has been.

The BLS jobs report also reported that the unemployment rate had fallen to 7.6% from the previous 7.7%.  However, this was more than entirely due to the estimate that the number of workers in the labor force had declined by almost a half million.  The unemployment figures are obtained from a survey of households, while the figures on net new jobs created are from a separate survey of business establishments (along with government and non-profit entities).  There is more volatility in the figures from the household survey, as the effective sample size is a good deal less (each household surveyed will generally have only one or two household members in the labor force, while a business establishment can have thousands of workers).

Thus the published figures from the household survey from a single month are viewed with caution.  It is not clear why the estimated population in the labor force would have fallen by a half million in a single month, and analysts will want to see whether this holds up in coming months.  And while also figures from just one month, it is still disconcerting that the household survey estimated that the number of people with jobs actually fell by 290,000 in the month (while the number of unemployed fell by close to 210,000, with these two numbers together adding up to the half million fewer household members in the labor force).

The March jobs report was not a good one.  And with government cutbacks due to the sequester now becoming greater, there is reason to be concerned that the picture will become even worse in coming months.

The Job Record in Obama’s First Term: Private Jobs Grew, and Government Jobs Were Cut

Cumul Private Job Growth from Inauguration, to Jan 2013

Cumul Govt Job Growth from Inauguration, to Jan 2013

With the recent release by the Bureau of Labor Statistics of the January job numbers, we can now look at the job record of Obama over his full first term, and compare it to that in the first term of Bush or others.  These new BLS numbers also reflect the impact of the re-benchmarking revisions (done each year at this time), which we noted in a post on this blog in October would likely show a substantial upward revision in the private job estimates in 2012, along with a substantial downward revision in the government job estimates.  The graphs above reflect these new numbers, and show cumulative job growth, private and government, over the full first terms of Obama and Bush.

Mitt Romney and his fellow Republicans repeatedly charged in the recent campaign that private job creation plummeted under Obama, while he boosted government spending and jobs for bureaucrats.  The exact opposite happened.  Private jobs were indeed plummeting when Obama took the oath of office in January 2009, as he inherited the economic crisis that had begun in the last year of Bush.  But through the stimulus package and other measures (including in particular aggressive action by the Fed), he was able to turn this around quickly.  The economy started to grow again six months after he took office, and private jobs began to grow a year after he took office (see the top graph above).  Private job growth has continued at a fairly steady rate since, and by the time Obama took the oath of office for his second term, there were over 1.9 million more workers employed in private sector jobs than when he took the oath of office for his first term.  More significantly, there were 6.1 million more private sector jobs when Obama ended his first term term than there were at the trough a year after he took office.  And as the graph above shows, the pace of new private job creation has not slowed since that trough three years ago.

In contrast to the Obama record, private jobs fell during the first term of George W. Bush.  There were 950,000 fewer workers employed in private jobs when Bush started his second term than when he started his first.  They were also not plummeting when he first took office, as they had been under Obama, but only started to fall a few months later.  They then continued to fall for the first two and a half years of his term before finally starting to rise.  And when they finally started to rise, they grew at a slower pace (102,000 per month) for the last year and a half of Bush’s first term, than they did (at a pace of 170,000 per month) over the final three years of Obama’s first term.

Yet Republicans continue to argue that the policies under Bush, of tax cuts and lax or no proper regulation, are necessary to support the “job creators” and lead them to create private sector jobs.  The record shows that the approach followed under Obama was far more successful.

Government jobs followed a very different pattern.  Government jobs (at all levels of government, including state and local) grew by 900,000 over the four years of Bush’s first term, but they fell by 720,000 over the four years of Obama’s first term.  This is a net difference of 1.62 million jobs.  (The sharp peak in quarter 16 was due to hiring to fill temporary jobs for the decennial census.  Government jobs soon returned to their previous declining path as these census jobs ended.)

With a current labor force in the US of 156 million, the simple direct impact, had one allowed government jobs to have grown during Obama’s term as they had during Bush’s first term (the net difference of 1.62 million jobs), would have been to reduce the unemployment rate by 1.0%.  That is, the direct impact would have been to reduce the unemployment rate to 6.9% from the current 7.9%.

But there would also have been indirect impacts, as the newly employed government workers would have purchased goods and services with their new income, which would have in turn employed workers to produce those goods and services.  With a conservative estimate of this multiplier at two, unemployment would now be at 5.9%, which is within the range of 5 to 6% unemployment which is generally considered to be full employment (unemployment will never be zero).

There would of course also be a budgetary cost to employing more government workers.  But it is not that much.  Using BLS data on the average total compensation costs (including benefits) for government workers, employing an additional 1.62 million public sector workers would cost $140 billion per year.  While significant, this is only 2.5% of the $5.7 trillion that government spends each year (at all government levels) in the US currently.  Furthermore, the net impact on the budget will be a good deal less as there will be increased tax revenues generated as more people are employed (both directly and indirectly).

The still high unemployment in the US can therefore be accounted for by the decline in government employment during Obama’s first term.  Had government jobs been allowed to grow as they had under Bush, we would now be at, or at least close to, full employment.  Furthermore, while the calculations here use the growth of government employment during Bush’s first term as the benchmark, that growth of 900,000 government workers under Bush was not out of the ordinary.  Government employment grew by a bit less during Clinton’s first term (by 690,000), but by more during the term of Bush’s father (by 1,240,000).  Government employment also grew by 850,000 during Bush’s second term.

One would expect government to grow in an economy that is growing with a population that is growing.  The growth in government employment during Bush’s first (and second) terms was not unusual nor was it inappropriate.  Rather, what was unprecedented was the sharp fall during Obama’s first term.  Never before in US history (at least as far back as 1939, when the BLS statistics start) has government employment fallen by so much during a presidential term.  The only instance that can rival it is the fall after World War II during the 1945-49 term, when government employment fell by half as much as it had under Obama (by 360,000 then, vs. by 720,000 under Obama).

The sharp cut-back in government jobs under Obama is therefore historic.  It can account for the still high rate of unemployment.  It would not cost that much to hire back the school teachers, health care workers, policemen and firemen that have lost their jobs or have not been able to get such jobs.  Yet despite such historic cuts, Obama is still seen by conservatives as a socialist presiding over a government exploding in size.