
Job Market Dynamics: A Continued, But Slow, Recovery

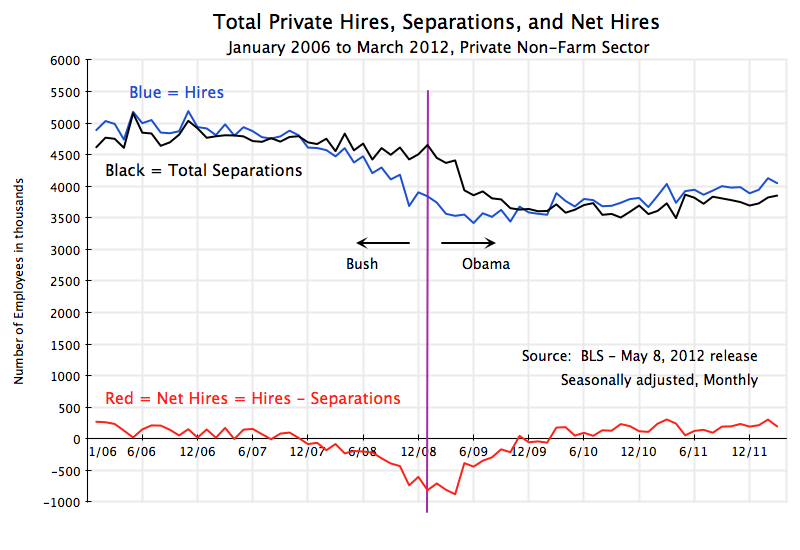
Jobs, employment, new hiring, job separations, net job creation, January 2006 to March 2012


employment, jobs, total separations, layoffs and discharges, quits, January 2006 to March 2012This post is an update of one from January of this year, with more recent data and to reflect revisions that have been made in the earlier figures.  The numbers are from the Bureau of Labor Statistics, and this spring it issued new figures for the last several years, reflecting methodological improvements in the system it uses to go from its survey results to its national estimates.  What is shown above and will be discussed below are jobs in the private non-farm sector.  Government jobs have been falling, as has been noted in this blog, but follow a different dynamic than private jobs.  Hopefully government jobs will now stabilize and preferably grow, rather than continue to act to depress the economy.

The story on the private job dynamics is the same as before, and the more recent numbers (through March in the figures above, vs. through November 2011 in the January posting) confirm the trend that was noted before.  That is, the job market is recovering, but at too slow a pace given the still high level of unemployment.  At such a slow pace, it could easily go into reverse should the economy slow.  As has been noted before in this blog, US GDP growth has been slow due to the continued fiscal drag as government expenditures have been cut back.  There is also the threat of a European collapse, with negative impacts on the US, as Europe has failed to address the Eurozone problems with any policy other than increased austerity.  Growth in Europe is already at zero.

There is now the additional threat made recently by Speaker of the House John Boehner, to hold hostage the Congressional approval required for the debt ceiling later this year unless Republican demands of further government expenditure cuts are met.  Without this Congressional approval, the United States would be forced to default.  Economic chaos would result.

Among the points to note from the figures above:

1)  There were major net job losses in 2008 and 2009 (the curve in red in the top figure), but not because more people were leaving their jobs, due to layoffs or other reasons.  Rather, it was because the pace of new hiring slowed.  At the peak of the housing bubble in 2006, new hiring was being done at a pace of roughly 5 million jobs per month.  This started to fall, but slowly, in late 2006 / early 2007.  It began to fall at a rapid rate in 2008 (the last year of the Bush administration), and then stabilized and began to recover within a few months of Obama taking office, as the stimulus package and other measures began to have their positive effect.  From a trough of about 3 1/2 million new hires per month in mid-2009, new hires has slowly grown to a pace of a bit over 4 million per month currently.  That is, there has been some recovery, but the pace is still well below the 5 million new hires per month seen when the economy is at full employment.

2)  Total job separations, whether from layoffs or quitting or anything else, actually fell in the downturn.  People often believe that unemployment shot up in the downturn because of massive layoffs, but that is not really the case.  Unemployment went up not because of more people being fired or otherwise leaving their jobs, but rather because the pace of job separations did not fall as rapidly as did the pace of new hiring.  In normal times, more people separate from their jobs because they quit (usually to take a new job elsewhere) or voluntarily leave for some other reason (e.g. retirement), than leave because of being laid off.  The pace of layoffs and discharges did indeed go up in 2008, the last year of Bush, from roughly 1.7 million per month before the downturn, to a peak of 2.5 million in the last month of Bush.  But this was less than the fall in the number of people who voluntarily quit, so total separations actually fell.  And layoffs then soon started to fall in number under Obama, and is currently below 1.6 million per month, i.e. less than the pace seen when the economy was near full employment.

3)  Since late 2009, the pace of new hiring has risen under Obama, as noted above, from roughly 3 1/2 million per month to a bit over 4 million per month currently.  Quits also started to rise with the improving job market, from about 1.5 million per month to 2 million per month most recently.  This is a good sign, and an indication that people are voluntarily leaving their jobs as the pace of new hiring has improved.  And layoffs and discharges has slowly fallen over this period as well.  The result is that the pace of total separations have been below that of new hires since early 2010, with net new jobs thus being created.

But the pace of net new job creation has been slow, at only about 200,000 net new jobs per month over the last half year (other than 300,000 in February).  With unemployment still at 8.1%, it would take years to reach full employment at such a pace of net job growth.  That is, at a pace of net job growth of 200,000 per month and assuming growth in the labor force of about 0.65% per year (the rate seen in the past decade, as it depends on population growth and demographics), it would take over two more years for the unemployment rate to fall below 6%, and almost three and a half years to fall below 5%.  At 300,000 net new jobs per month, unemployment would fall below 6% in a more reasonable 15 months, and would hit 5% in about two years.

A pace of net new job growth of 300,000 per month is not at all impossible, but will require a sufficient growth in aggregate demand in the economy so that the goods and services these workers would produce could be sold.  As has been noted before in this blog, fiscal drag largely explains the slow growth in aggregate demand in the US:  Had government demand been allowed to grow during the Obama years at the pace it had during the Reagan period when the economy was recovering from the 1981 downturn, we would now be at close to full employment.

Taxes are the Lowest in Over a Half Century: But Low Taxes Have Spurred Neither Growth nor Jobs

US Federal Government Revenues as Share of GDP, 1960-2011, Federal Taxes, Federal Receipts

A.  Introduction

Personal income tax returns in the US were due last week.  With taxes on most people’s mind, blog postings on taxes in the US are perhaps timely.  This initial post will focus on how much has been paid in taxes in recent years, and whether there is any evidence for the assertion that high taxes have slowed economic growth and job creation.  Although it may not feel like it to those have just paid their taxes, the share of taxes in GDP has been at record lows during the Obama administration.  Subsequent posts will look at some of the idiocies in the tax code that we as filers face each year, and then at reforms to the tax code, both relatively straightforward (within the current basic structure) and more fundamental.

B.  Taxes Have Been at Historic Lows

As noted in a recent posting on this blog, Mitt Romney has repeatedly asserted that high taxes under Obama, due to tax increases under Obama, have led to the disappointing recovery from the 2008 economic collapse.  Mitch McConnell, the Republican leader in the Senate, has stated repeatedly in recent years (here is one example) that the US fiscal problem is “because we spend too much, not because we tax too little”.  And the new Republican term for the super-rich is that they are the “job creators”, and that therefore taxes on them need to be kept low and cut even further so that they will then “create” new jobs through some kind of trickle-down process.

Yet taxes as a share of GDP are the lowest in over a half century in the US (and in fact since 1950).  The graph at the top above shows total federal government revenues as a share of GDP, going back a half century to 1960.  Taxes (from all sources, not just individual income taxes) averaged almost 18% of GDP over this period, but began a clear downward trend from 2001.  The data is from the historical tables made available by the Office of Management and Budget, with data that goes all the way back to the founding of the republic in 1789.

The Bush tax cuts of 2001 and 2003 account for the change in trend.  With this change in trend, coupled with the effects of the 2008 economic collapse and then the further tax cuts (not tax increases) signed into law by Obama (discussed below), taxes as a share of GDP reached a low of just 15.1% of GDP in FY2009.  And with the tax cuts under Obama, taxes as a share of GDP remained at just 15.1% in FY2010, at 15.4% in FY2011, and are projected to be just 15.8% of GDP in FY2012.

Such a low tax take is unprecedented in the post-World War II United States.  Since 1950, taxes were never below 16% of GDP for any individual yearn prior to 2009, despite a number of economic downturns, much less so low for four years straight.  It is hard to see how our problems are from taxing “too much” when taxes are the lowest they have been in over 60 years.

Taxes collected in FY09 were low in part due to the 2008 economic collapse.  But the economy has been in recovery since the middle of CY2009, albeit weakly.  Despite this recovery, and in contrast to the experience in previous cyclical downturns, fiscal revenues have remained at record lows.  Average fiscal revenues over the three year period of the year of the economic trough plus the following two years were only 15.2% of GDP in the current downturn.  The similar average fiscal revenues over such three year periods in the other five economic downturns of the past four decades were 17.9% of GDP.  Cyclical factors cannot explain the current extremely low levels of taxes as a share of GDP.  Rather, taxes have been so low due to the downward structural trend that began with the Bush tax cuts, compounded then by further tax cuts signed by Obama.

As was noted in the earlier posting on this blog on Romney’s economic policy address, between February 2009 and February 2012 Obama signed into law almost $1.5 trillion of tax cuts.  For convenience, here is the table shown in that post, although with the Payroll Tax cuts now consolidated into one line:


Tax Cuts Signed Into Law by Obama    
  Date Signed Amount ($b)
A.  Tax Provisions in 2009 Stimulus Package 2/17/09 $420.0
B.  2010 Tax Cut Package, excl Payroll Tax Cut 12/17/10 $769.3
C.  2011 and 2012 Payroll Tax Cuts 12/17/10, 12/23/11, and 2/22/12 $227.1
D.  Other – Various Dates in 2009 and 2010 various $64.2
TOTAL   $1,480.6

The $1.5 trillion cost estimate is from figures posted by the bipartisan Committee for a Responsible Federal Budget, which in turn came from estimates obtained from either the Congressional Budget Office or the Joint Committee on Taxation of the US Congress.  One can also obtain from these sources estimates of how much of the tax cuts would occur by fiscal year, and the estimate, when added up, is that $1.4 of the $1.5 trillion in cuts were in fiscal years 2009 to 2012.  These are estimates, made before the fact and subject to uncertainty, but suffice for the basic point here.

Taking these tax cuts as estimated by fiscal year, expressed as a share of GDP, one finds:

      Impact of 2009-2012 Obama Tax Cuts
Taxes/GDP:  Actual 2009-2012 Tax Cuts Enacted Taxes/GDP If No Tax Cuts
FY09 15.1% 0.8% 15.8%
FY10 15.1% 2.1% 17.2%
FY11 15.4% 2.9% 18.3%
FY12 proj. 15.8% 3.2% 19.1%

The tax cuts were large, especially from FY2010 onwards.  While taxes as a share of GDP would still have been a relatively low 15.8% of GDP in FY2009 (reflecting the downturn which reached its trough that year), taxes in the subsequent years would have been close to what they have normally been since 1960 (an average of almost 18% of GDP).  That is, while taxes as a share of GDP were low in FY2009 largely due to the downturn, they have since remained at historically low levels largely due to the tax cuts signed by Obama.

Critics will of course state immediately that without the tax cuts signed by Obama, GDP recovery would have been even slower.  This is true, given the recession.  But a reduction of GDP of two or three percent or more, while of course not to be welcomed, would not have had a major impact on these figures on GDP shares of taxes.  The denominator would have just been reduced from 100% to 98 or 97%.  Furthermore, a reduction in the denominator would (by simple arithmetic) have raised, not lowered, the GDP shares of taxes.

While a more complete modeling exercise would have been desirable, it would still have been a model and subject to all the limitations and criticisms any model will have.  The point being made here is just the simple one that the tax cuts signed by Obama were big, and that they were the primary factor leading to the historically record low shares of taxes in GDP during Obama’s term, especially from FY2010 onwards.

C.  Do Lower Taxes Lead to Faster Growth in GDP or Jobs?

Mitt Romney and the Republican Party leaders also repeatedly assert that cuts in taxes, including on the rich, will lead to faster growth in both output (GDP) and jobs.  The super-rich now have the new name of “job creators”.  But is there any historical evidence to support this?

The following table shows for the US by decade, since the 1960s, the average collection of taxes as a share of GDP, growth in GDP and in jobs over the decade, and the average highest tax bracket on ordinary income in the tax code (the rate the super-rich will pay on ordinary income) in the decade:

Taxes/GDP Period Avg GDP Growth Rate Jobs Growth Rate Highest Tax Bracket – Period Avg
1961-1970 18.0% 4.3% 2.8% 78.4%
1971-1980 17.9% 3.2% 2.5% 70.0%
1981-1990 18.2% 3.2% 1.8% 44.2%
1991-2000 18.8% 3.3% 2.0% 37.9%
2001-2010 17.1% 1.6% -0.2% 35.8%
Bush term:
2001-08 17.6% 2.2% 0.2% 36.0%

Sources:  Taxes/GDP and GDP growth calculated from OMB Historical Tables; Job growth from Bureau of Labor Statistics; and Highest tax bracket from Tax Policy Center.

Taxes as a share of GDP did come down, and were at their lowest of any decade, in the 2001-2010 period.  The decade average for the highest tax bracket was also the lowest.  But while GDP grew by between 3.2% and 4.3% a year in the preceding four decades, growth fell to just 1.6% a year in the decade with the lowest taxes.  Job growth was between 1.8% and 2.8% a year in the preceding four decades, but fell to a negative 0.2% when taxes on the “job creators” were at their lowest.  The bottom line of the table also shows the figures for just the Bush term of 2001 to 2008, before the full effects of the 2008 downturn were felt, to show that these results are not simply a consequence of the downturn in the final years of the decade, weighing down the decade long results.

Such a comparison across periods is simplistic, of course.  There is much else going on.  But there is no evidence here that the Bush tax cuts, and the recent tax cuts keeping taxes low, have led to a long-term structural rise in the growth rate of the economy, or of the jobs being generated.  The evidence that exists is completely inconsistent with this, and indeed by itself it consistent with the opposite.

D.  Conclusion

To summarize:

1)  Taxes as a share of GDP are now at record lows, and have been since Obama took office.

2)  Other than in FY2009, when the economy was at its trough following the 2008 collapse, the record low share of taxes as a share of GDP has been largely due to a series of very large tax cuts signed by Obama.  That is, the shares of taxes have remained at record lows largely due to policy, and not due to the weak economy.

3)  There is no evidence from US history of the past half century which would suggest that lower tax collections or a lower tax bracket for the super-rich will lead to a higher growth rate for the economy or for jobs.  In fact, the downward trend in taxes since the Bush tax cuts of 2001 and 2003 has been associated with the lowest decade long growth rates of GDP or jobs of the past half century.

A previous posting on this blog showed that the US public debt problem (with a rising public debt to GDP ratio) is fully due to the impact of the Bush tax cuts.  That blog posting showed that simply be phasing out the Bush tax cuts from 2014 onwards, the public debt to GDP ratio would be brought back down over time, rather than grow explosively (if there is no change to current policy).  The Bush tax cuts by themselves account for the US fiscal problems of at least the next decade.

With record low tax collection as a share of GDP, with the downward trend in tax collection a consequence of the Bush tax cuts of 2001 and 2003, with subsequent extensions of these tax cuts signed by Obama along with other major tax cuts passed as part of the stimulus package and in payroll taxes leading to record low tax collections in the US as a share of GDP, and with no evidence that the lower taxes of the past decade have led to higher long term growth rates of the economy or of jobs, it is difficult to see how the current economic difficulties are due to taxes that are too high.  To deal with a problem, one must first recognize its origins.  The Bush tax cuts were a disaster for the economy, and restoring tax rates (over time, once the economy is in a more solid recovery) to what they were in the 1990s would solve America’s fiscal problems.

Employment Growth in January: Better, but Sustainability is a Concern

The employment report for January, released this morning by the Bureau of Labor Statistics, is a positive report.  But while employment growth is now improving, it is still not rapid enough, and its sustainability is a concern.

As I had noted in a posting on December 5 in this blog, monthly employment growth in the US needs to be in a range of roughly 200 to 250,000 per month for unemployment to fall on a sustainable basis.  One is now starting to see that, with overall employment growth of 203,000 in December and 243,000 in January.  With such growth, the unemployment rate fell from 8.9% in October to 8.7% in November to 8.5% in December and to 8.3% in January.  This is certainly welcome.  But unemployment at 8.3% is still far too high.  In a more robust recovery, one would be seeing monthly employment growth figures of over 300,000.

And the overall employment figures are still being held back by falling employment in government (mostly state and local government, which accounts for 87% of government employment in the US, but there have also been falls in federal employment).  In January, total government employment fell by 14,000, thus partly offsetting the rise in private employment of 257,000, to produce the overall gain of 243,000.

For the past year (January 2011 to January 2012), government employment fell by 276,000.  This has been a significant factor in holding down overall employment growth.  And government employment fell by 230,000 in the year before that (January 2010 to January 2011), and fell by 97,000 in the year before that (January 2009, when Obama was inaugurated, to January 2010), for a total fall in government employment of 603,000 over the three years.  In the three years before Obama took office, government employment rose by 248,000 in 2006, rose by 281,000 in 2007, and rose by 200,000 in 2008, for a total increase of 729,000.

Yet Obama has been repeatedly accused of creating an explosion of government.  (For a more detailed review of what has happened to Federal Government employment alone, see this blog.)  Had total government employment risen by 600,000 rather than fallen by 600,000 since Obama took office, one would have had an extra 1.2 million jobs directly.  Even ignoring any multiplier impact, this by itself would have led to an unemployment rate now of 7.5% rather than 8.3%.  And assuming, conservatively, a multiplier of just two (so that one additional government job leads to one additional private job, to supply the goods to cover the increased personal spending of the now employed government workers), the unemployment rate would now be a more respectable 6.7%.

While the January employment report was positive, one should keep in mind that there are threats on the horizon.  Two to consider:

1)  As noted in a January 27 blog, GDP growth in the fourth quarter of 2011 was only 2.8%, and 70% of this came from the change in the change in private inventories.  Without this inventory change, GDP would have grown by just 0.8%.  For the first quarter of 2012, it is unlikely that private inventories will again go up by so much.  And note that because it is the change in the change in private inventories that is the contribution to GDP growth (see this blog), then should private inventories once again increase by as much as they did in the fourth quarter of 2011, the growth in GDP in the current quarter would only be 0.8% (everything else being equal as in the fourth quarter of 2011, which of course it won’t be).  That is, inventories would have to continue to rise by as much as they did in the fourth quarter of 2011 simply to keep GDP growth at 0.8%.  They are likely to rise by far less, and quite possibly might fall if the high level of inventory accumulation in late 2011 was more than suppliers wanted.  This could then significantly hold back production and GDP growth, and hence employment growth, over the next several months.

2)  Europe continues to be problematic, with the focus on policies (fiscal austerity) which will make the situation worse rather than better.  Europe will certainly be in recession in 2012, and probably already is, and this will hurt the US recovery.

And there are of course other risks, such as, for example, an escalation in tensions with Iran leading to disruption of shipping through the Strait of Hormuz, that could cause oil prices to skyrocket.  There are many such scenarios that one can imagine, so a US recovery is anything but certain.  So while the January employment report was a positive one, there are still reasons to be concerned.