
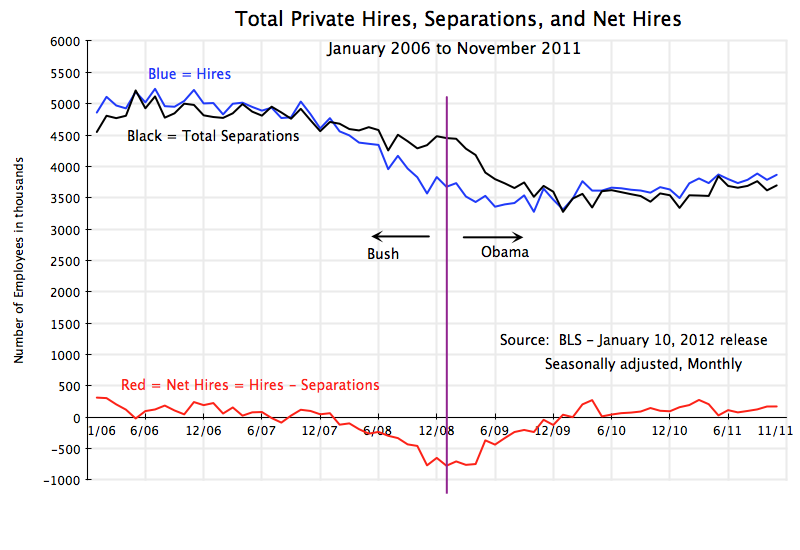
 The most closely watched jobs number reported each month, aside from perhaps the unemployment rate, is the figure normally referred to as “new jobs created”. For example, on January 6, news reports on the Bureau of Labor Statistics release that day stated that “200,000 new jobs were created” in December. But many people may not fully realize that that number is a net figure, and the news reports often speak as if it is all new hiring. Actually, around 4 million people are being hired each month right now in the US, while close to that number are also leaving their jobs for various reasons (mostly quits to take some job elsewhere). It is the net figure between these two that is the 200,000.
To understand what is going on in the labor market, it is important to disentangle the figures. The graph above shows the numbers since January 2006 (and up to November 2011, the most recent figure available) on total private sector hires each month, total private sector separations for whatever reason (this will be broken down below in this post), and the net between the two. One could also include government employment, but I have left it out to focus on the private sector labor market dynamics. Government employment is much smaller (government employment is less than 17% of total employment in the US, and 87% of government employment is with state and local governments). It is also generally more stable and has been, other than a blip due to temporary hiring at the time of the 2010 census. And government employment has been trending downward during the Obama period (mostly due to falls in state and local government employment, as I discussed in a December 6 post).
The first interesting point to note is how much churn there is in the labor market. This is not commonly appreciated in the discussion surrounding the monthly figure on “new jobs”. Hiring is always going on, and people are always leaving their jobs for various reasons (whether quitting to take a new job elsewhere, or retiring, or being laid off, in both good times and bad – this will be reviewed below). This churn is high. For example, over the twelve months leading to November 2011, 48.6 million people were hired, while 47.2 million left their job for whatever reason, leaving a net job growth of 1.4 million (these figures include government).
And such hiring continues in both good times and bad. Hiring fell from around 5 million a month before the downturn, only to around 3 1/2 million per month in the worst of the economic collapse in 2008 / 2009. The unemployment rate peaked at over 10%, but even in this period, new hiring was being done at around two-thirds the rate it was before. Yet many Republican critics asserted that “no one” was being hired due to Obama’s regulatory policies. In fact, the fall in hiring largely came before Obama entered office, stabilized within a few months of his inaugeration, and since has risen, although not by enough.
With this break-down, it is also interesting to see that the deterioration in the labor market began as early as 2006, when private new hiring began to slow. Housing prices had also reached their peak in 2006, and then began to fall. While the collapse in the economy was in full swing only in 2008, in the last year of the Bush Administration, the deterioration in conditions had in fact started two years earlier.
With new hiring starting to slow from 2006, the number of people leaving their jobs for whatever reason (“total separations” in the graph) started to slow in 2007. As labor market conditions deteriorated in 2007 with the lower new hiring, fewer people would choose to quit. They did not have a new job to go to. With both hiring and quits down together, net jobs (hiring less separations) generally remained positive in 2007. But by 2008, new hiring was falling fast, and while total separations also fell, hiring was now less than separations, so net jobs fell fast.
Things then began to turn around within a few months of Obama taking office, due to his stimulus and other policies. New hiring stabilized at about 3 1/2 million per month, while total separations continued to fall. Fewer people were being laid off than they were when Obama took office (see below). Net job losses stabilized (the trough was March 2009) and then began to improve. While Republicans continue to assert that Obama’s policies have harmed job creation, the turnaround occurred exactly as soon as his policies could start to have an effect. And the job situation has continued to improve since then, although not by enough given the depth of the hole the economy was in when Obama took office.
As noted above, the Total Separations figure is the total separations due to people quitting voluntarily (normally to take a better job elsewhere), people being involuntarily discharged either due to layoffs or due to poor performance, and other separations (mostly due to retirement). The figures since 2006 are shown below:
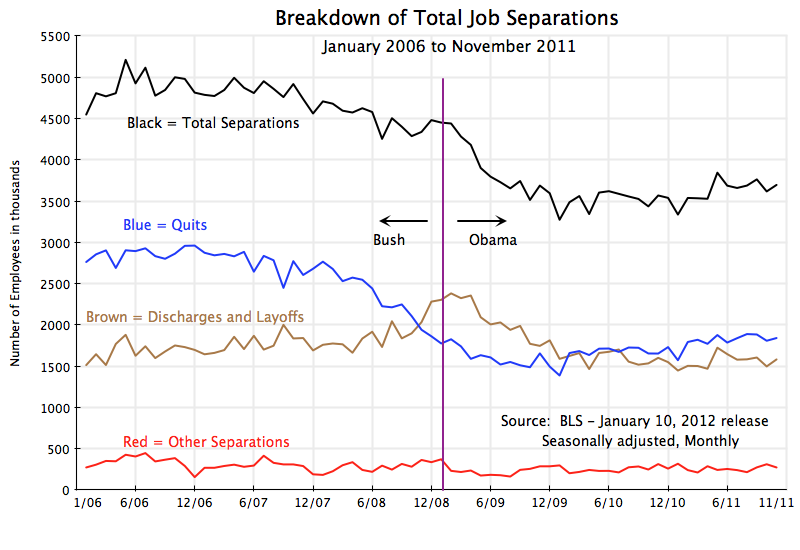 It is interesting that while involuntary discharges and layoffs rose with the 2008 economic collapse, the increase was all in the second half of 2008, and was from 1.7 million per month in “normal” times, to a peak of just 2.4 million per month. That is, there are always involuntary discharges and layoffs for various reasons, but in the worst economic downturn since the Great Depression it increased by less than half. And since the end of 2009, monthly discharges and layoffs have been lower than they were prior to the downturn in 2006 and 2007. One cannot say that Obama’s policies have led to more workers being laid off.
As noted above, quits started to fall in 2007, as labor market conditions started to deteriorate with the fall in new hiring. They reached a trough in late 2009 / early 2010, and since have risen a bit, as labor market conditions began to improve. But they remain well below what they were in 2006, as labor market conditions, while better than in 2008/2009, still remain poor, with 8 1/2% unemployment. But people still do quit, at a rate of about 1.8 million per month, vs. quits of close to 3 million per month at the peak of the housing bubble.
Labor market conditions remain weak, with unemployment far too high. It is unfortunate that political pressures are keeping the Obama administration from doing more to bring unemployment down, and indeed are forcing measures (such as cuts in fiscal spending) which are making the situation worse than it would otherwise be. But the labor market turned around within a few months of Obama taking office, and has improved since. There is still much more that needs to be done to bring down unemployment, but the charge that Obama’s policies are the cause of the high unemployment, is simply not backed by the facts.

 An Economic Sense

You must be logged in to post a comment.