Homicides by Firearms in the US: An International Comparison of Homicides and Criminality Rates

Homicides by Firearms Across Countries

Introduction

It is well known that the rate of homicides due to firearms is higher in the US than in other developed countries.  What some might not realize is how much higher.  But some then argue that while the US rate of homicides by firearms might be high, homicides can be carried out by other weapons, such as knives and clubs, and that when one takes these into account, the overall homicide rates are similar.  This is simply not true.  Some also argue that the US suffers from especially high criminality for social, cultural, economic, or whatever reasons, and that homicide rates in the US are just similarly high.  This is also simply not true.

This blog post will examine these assertions through a series of simple charts.

Homicides by Firearms

First, the chart above shows the rate of homicides due to firearms in the US as compared to Japan, the UK, France, Germany, Ireland, New Zealand, and Iceland.  The data comes from the UN Office of Drugs and Crime, as part of its 2011 Global Study on Homicide.  The figures are for 2008, the most recent year for which data were available for most of the countries on the list (2007 for France)

Japan, the UK, France, and Germany were chosen as other large, developed, countries with per capita incomes comparable to that of the US.  All are members of the OECD, the “club” of developed countries that, among other activities, share data and analyses.  Ireland, New Zealand, and Iceland (also OECD members) were added for reasons that will become clear below.  Briefly, these three countries plus the UK had the highest rates of overall criminality among the 26 OECD members, which make them interesting comparators.

As the chart above shows, homicides by firearms are tiny in the comparator countries relative to what they are in the US.  The US rate in 2008 was over 3.6 homicides per 100,000 population.  As was noted in a previous posting on this blog, this rate had come down by almost half during the 1990s.   But a 3.6 rate pales in comparison to rates of only 0.009 in Japan, 0.06 in the UK and France, 0.2 in Germany, 0.5 in Ireland, 0.2 in New Zealand, and exactly zero in Iceland (where there no homicides at all in 2008).  Put another way, the rate in the US was 424 times higher than it was in Japan, and about 60 times higher than in the UK and France.

Homicides by Any Method

But perhaps a higher rate of homicides by firearms in the US is being offset by higher rates of homicide by other means in the other countries?  If so, then all the overall homicide rates would be comparable across the countries.  But no, this is not happening:

Homicides by All Methods Across Countries

The overall US homicide rate of about 5.5 still remains far above the rates of between 0.5 and 1.3 in the other countries (and of exactly zero in Iceland).

Homicides by Means Other Than Firearms

Looking at the rate of homicides by means other than firearms:

Homicides by non-Firearms Across Countries

Here the rates are at least comparable to each other.  While the US rate remains the highest, at a rate of 1.8 per 100,000, the rates for the others are between 0.5 and about 1.25 (other than the rate of zero for Iceland).  But there is no basis for the argument made by some gun advocates in the US that if one restricted access to guns, that the homicides would take place anyway, but by means of knives and clubs and other weapons.  One does not see this in the other countries.  Firearms are not substituting for other weapons in the homicide rate.  The data rather are consistent with firearms adding to the rate of homicides by other methods, leading to a very high overall rate for the US.

Victims of All Crime

But perhaps the US is a country with a particularly high rate of criminality?  If so, the high homicide rate might be explained by an also high rate of overall crime.  But this is not the case:

Crime Victimization - All Crimes, Across Countries

The number of victims of crimes in the US (as a share of the population) is in the middle of the range for this set of comparator countries.  In the US, about 17.5% of the population had been the victim of a crime (burglary, theft, robbery, sexual assault, other assault or threatened assault) over the preceding 12 months.  The rates were between 10 and 13% in Japan, France, and Germany, but between 21 and 22% in the UK, Ireland, New Zealand, and Iceland.  These latter four countries had the highest rates of any countries in the sample of 26 OECD countries with data.  The overall OECD average was 15.5%.  The US rate ranked #17 of the 26 countries.

[These data come from an international sample survey undertaken periodically with UN support, that covered 30 countries in 2004/2005 (the most recent available).  This International Crime Victims Survey asked a statistically valid sample of individuals in each country a range of questions on whether they had been a victim of a crime (broken into a number of categories) over the previous 12 months.  The data here comes through the OECD, which posted it in convenient spreadsheet form.]

Criminality in the US, in terms of the number of victims as a share of the population, is therefore somewhat above the OECD average, but is by no means the highest.  Nine of the 26 OECD countries were worse.  The four worst countries were the UK, Ireland, New Zealand, and Iceland.  But as seen in the chart at the top of this post, their rates of homicide by firearms are tiny compared to the rate in the US.  Relatively higher rates of criminality are not associated with higher rates of homicides by firearms.  The same holds true for homicides by any method.

Victims of Assault

It might also be argued by some that it is not the overall rate of criminality that matters to homicides, as this includes crimes such as burglary where the victim is not present.  Rather, they might argue, it is the rate of assault or the threat of assault that matters, as it is here where homicides might occur.  But there is no evidence to support this either:

Crime Victimization - Assaults & Threats, Across Countries

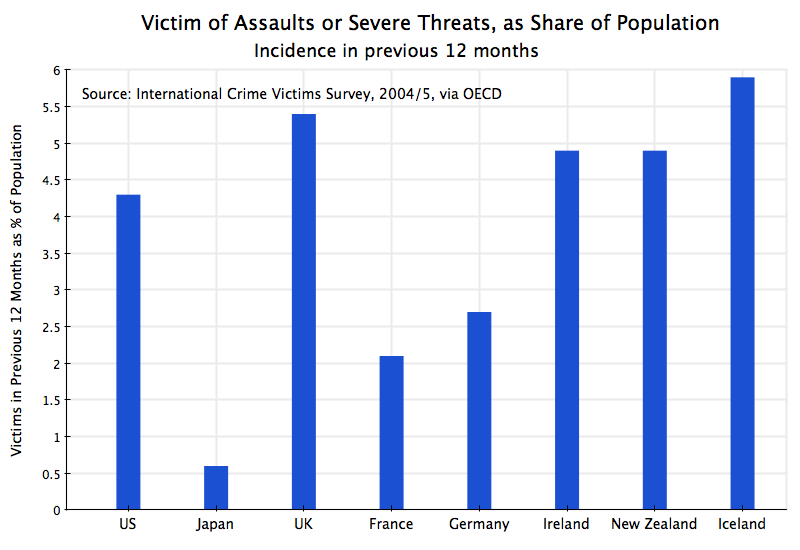
The US rate of 4.3% is again by no means the highest rate among the OECD members.  The UK, Ireland, New Zealand, and Iceland again all have higher rates (of 4.9 to 5.9%).  These latter four countries are again the worst four among the 26 OECD members.  The US rate of assault is well within the range for the OECD countries, yet its homicide rate by firearms is far higher.  And countries with higher rates of assault have far lower rates of homicide.

Conclusion

To conclude, the rate of homicides in the US by firearms is incredibly higher than the rate seen in other OECD countries.  This cannot be explained by a substitution of firearms for other weapons which would have been used anyway to commit the homicide, nor can it be explained by an especially high rate of criminality in the US.  There are more victims of crimes as a share of the population in other OECD countries, who nevertheless have far lower homicide rates.

The easy availability of firearms in the US, instead of the tight controls seen in other developed countries, certainly has something to do with this.

Impact of the 1994 Assault Weapons Ban on Homicide Rates and Mass Shootings

US Murder Rates, 1980 to 2010Mme. Marie Curie (Nobel Laureate):  “Nothing in life is to be feared, it is only to be understood.  Now is the time to understand more, so that we may fear less.”

[Note:  An update to this post, with more recent data as well as a discussion of what should be done for a more effective ban, was posted on this blog on March 17, 2018.]

Introduction

The horrific shootings at Sandy Hook Elementary in Connecticut in December, in which 20 school children aged 6 and 7 died, led to an outcry for effective measures to stop this from happening again.  The gun control measure most commonly called for was reinstatement of the ban on assault weapons (the type of weapon used in the Sandy Hook shooting) that Congress had passed in September 1994.  The law had a 10 year sunset provision, and with the more conservative political climate in 2004 during the Bush Administration, efforts to renew the law were blocked.  Hence it expired in September 2004.  The mother of the Sandy Hook shooter was then legally eligible to purchase an assault weapon, and her son used the one she had at their home to kill the 20 school children, after he first shot his mother.

But did the 1994 Assault Weapons Ban law have an effect on homicides in the US, and separately on mass shootings?  This note will review what we might be able to say from simple trends over time.

US Homicide Rates Fell in the 1990s

The chart above shows US homicide rates between 1980 and 2010, with a breakdown (for 1980 to 2008) of the number of homicides as a result of the use of any gun, by handguns only, and by all other guns.  Other homicides could be through the use of knives or other objects.  The source is a report dated November 2011 on homicide trends in the US over 1980 to 2008, prepared in the Bureau of Justice Statistics of the US Department of Justice, and is the most recent such report available from this source.

The chart shows that homicides did indeed decline sharply over the 1994 to 2004 period that the law was in effect (more precisely, September 13, 1994, to September 12, 2004).  The overall homicide rate in the US was 9.5 deaths per 100,000 population in 1993, and this fell to a rate of 5.6 in 2005.  The homicide rate from use of guns fell from 6.6 in 1993 to 3.8 in 2005.

While these homicide rates are an improvement over what they had been, keep in mind that compared to other developed countries, the rates are still abysmal.  Based on UN assembled data for 2010 (or the most recent year available), the total homicide rates were just 1.2, 0.8, 1.1, and 0.4 for the UK, Germany, France, and Japan respectively, and the homicide rates by firearms were only 0.1, 0.2, 0.1, and 0.0 for the four countries (where the rate in Japan rounded to 0.0 per 100,000 population as there were only 11 homicides in Japan in 2008, the most recent year with data available in the UN report on this; in 2008, the US had 11,030 homicide deaths by firearms.  Japan has strict gun controls.).

But can one attribute this fall in the homicide rate to be a consequence of the Assault Gun Ban then in effect?  From just the relationship found in the chart, not really.  There was much else going on during this period which could and probably did also have an impact on homicide rates.  In addition, one can see in the chart that the decline in homicide rates began before the new law went into effect, and that the large fall then bottomed out around 2000, after which there was a small rise.  Furthermore, one does not see a jump back to previous rates once the ban was allowed to expire in September 2004.  Looking at this relationship over time, a stronger case could probably be made that the drop in the homicide rate was more due to the totality of measures implemented during the period of the Clinton presidency, from January 1993 to January 2001.  This fits well the observed period when the homicide rate dropped.  But here again, there was much else also going on which could affect the homicide rates, including at the level of state and local governments.

Mass Shootings, 1982 to 2012

It is also arguable that the metric used above (the overall homicide rate) is not the metric that should be used when assessing whether the Assault Gun Ban helped.  The Assault Gun Ban only affected one category of gun (semi-automatic weapons), and highly imperfectly at that (which will be discussed below).  Most murders are done with simple handguns.  Particularly with the Sandy Hook shooting of school children very much in mind, can one say whether the 1994 Assault Gun Ban may have reduced the number of, and severity of, mass shootings?

Following the Sandy Hook shooting, Mother Jones magazine recently updated a data set it had earlier prepared (after the Aurora theater shootings) on mass shootings in the US since 1982.  Using specific criteria to define what to include as a mass shooting (four or more people shot in a single incident; one shooter; the shootings occurred in a public place; and some other factors and with some specified exceptions), Mother Jones provides a well documented data set concluding that there were 62 mass shootings meeting its criteria over this period.  They provide brief descriptions of each event, what weapons were used, the number of fatalities and the number of those wounded, and other relevant data.

Based on this data set, the following graph shows the number of mass shooting incidents in each year from 1982 to 2012:

Mass Shootings, Number by Year, 1982-2012

The number of mass shootings meeting the specified definition averaged 1.5 each year between 1982 and 1994, and possibly might have been rising in the period leading up to 1994 (I say possibly as the number of events are small, and it is not clear this is statistically significant).  The annual average was about the same, at 1.6 per year, between 1995 and 2004, but with this average brought up by a high number in 1999 (the year of the Columbine High School shooting, but where there were five mass shootings in total), and to a lesser extent in 1998 (with three mass shootings).  The numbers were low in the other years.  After the Assault Gun Ban expired, the frequency went up, reaching 3.4 per year on average between 2005 and 2012, with an especially high number (seven) in 2012.

The data set also has the numbers over time on the number of fatalities and of all victims (including those wounded):

Mass Shootings, Fatalities and Total Victims, 1982-2012

Using the numbers underlying this figure, over 1982 to 1994 the number of fatalities in mass shootings averaged 8.5 per year and the number of total victims (including those injured) averaged 18.2.  Over the period 1995 to 2004, the number of fatalities fell somewhat to 6.4 per year while the total number of victims fell to 13.2.  The averages were higher than otherwise in this period due to the spikes in 1999 (the year of Columbine) and to a lesser extent 1998.  The numbers then went higher in the period 2005 to 2012, after the Assault Weapons Ban expired, to 9.2 fatalities per year and 16.7 total victims per year.  2012 was a particularly bad year.

But with the limited number of years and small number of incidents involved each year, it is difficult to say whether there were significant changes over time, and in particular whether the fatalities fell significantly during the period the Assault Weapons Ban was in effect.  Were it not for 1999, and to a lesser extent 1998, the number of annual fatalities and victims would have fallen sharply during the period of the Assault Weapons Ban, and then risen again after it was abandoned.  But 1999 and 1998 did occur, so it is hard to say whether the impact was significant.

The underlying numbers also indicate that over the period as a whole, 73% of the weapons used in the mass shootings (and there were typically multiple weapons used in each mass shooting) were either semi-automatic handguns or long-barreled assault weapons.  Both were in principle banned under the Assault Weapons Ban, but only the manufacture and sale of new such weapons were banned –  the existing stock remained.  Such weapons accounted for 67% of the weapons used in the mass shootings between 1982 and 1994, for 74% of the weapons during the period of Assault Weapons Ban was in effect, and for essentially the same share of 75% in the period 2005 to 2012 when the law had expired.  There was no significant change during the period of the Assault Weapons Ban.

Limitations of the Assault Weapons Ban Law

The evidence is therefore not clear whether the 1994 Assault Weapons Ban had a significant effect.  But part of this is certainly a consequence of the “ban” being extraordinarily weak.  While the law was controversial, and some attribute the loss of the Congress by the Democrats to a resurgent Republican Party that year (when Newt Gingrich became Speaker) to passage of the act, the act itself did little to “ban” assault weapons, despite the title.

First of all, the law only affected the manufacture and subsequent sale of newly produced assault weapons.  The existing stock of such weapons would remain, and could be sold or transferred between owners.  In anticipation of the law, manufacturers flooded the market with a huge supply of newly produced weapons.  Second, the law defined “assault weapons” in a highly specific way.  As an advocacy group later noted, gun manufacturers soon found they could circumvent the law with what were little more than cosmetic changes to the existing arms.  Finally, while the Assault Weapons Ban also limited the manufacture and sale of newly produced high capacity ammunition magazines (limited to ten rounds or less), the manufacturers also ramped up production of these clips and flooded the market in the period before the law went into effect.  The high capacity clips were still widely available in 2004.

With these limitations in the law, it is not surprising that it is difficult to determine with any confidence whether the law had an effect on homicides and mass shootings.  And it appears as I write this, that President Obama is likely to propose tomorrow, January 16, a new assault weapons ban as a center piece of his initiative to reduce gun violence.  I would certainly welcome this.  But for the law to be effective, it will be very important that it take into account and remedy the limitations that made the 1994 Assault Weapons Ban so weak.  And I do not expect that the current Congress will do this.

The Need for Serious Analysis and Research

It is also clear that the limitations that have been placed on serious research on the causes of gun violence has to end.  These were discussed in a previous posting on this blog.  As discussed there (and also see a recent summary here), the limitations on research have been imposed by a conservative Congress at the instigation of the NRA.

A good recent summary of the problem is provided in an open letter to Vice President Biden (as chair of the Commission on Gun Violence) signed by a senior group of 108 professors and analysts from prominent universities and institutions.  Despite the importance of gun violence to our health, the US Centers for Disease Control and Prevention (CDC) has been effectively blocked from sponsoring research on understanding the issue, and the CDC and the US Bureau of Alcohol, Tobacco, Firearms, and Explosives (ATF) have not been allowed even to assemble and disseminate relevant data.

As a consequence, high level review commissions have been forced to say, honestly, that we simply do not know what the impact of various possible gun measures might be.  Comprehensive reviews in 2003 by the CDC and in 2004 by the National Research Council of the National Academies of Sciences had to conclude that the research has not been done, nor even the data assembled to permit such research to be done, to determine what might be effective in curbing gun violence.  And as the CDC report notes in its up front summary:  “insufficient evidence to determine effectiveness should not be interpreted as evidence of ineffectiveness.”  They both called for further work, but I am not aware of a similar commission and review since 2003/2004, which itself is indicative.

It is extremely important to keep in mind that while we do not have adequate analysis which can allow us to say with any certainty what measures might be taken to reduce gun violence, that does not mean that measures to control the availability of firearms will not be effective.  We do, after all, see the lower homicide rates, and especially the far lower homicide rates by firearms, in countries that have controlled access to firearms, such as most of Europe and Japan.  Figures are cited above.  And it is not true that the overall level of crime is especially high in the US.  According to statistics issued by the OECD, the overall crime rate in the US, as well as the rate of criminal assaults and threats, are in the middle of the ranges for the 26 OECD members reviewed.  Where the US stands out is not in criminality, but in homicides resulting from criminality.

The easy availability of guns certainly has something to do with this.

Update:  An observant reader noted that in my original post I had mistakenly referred to Sandy Hook Elementary as Sandy Hill Elementary.  I have corrected that in the above.  My thanks to that reader.


The Virginia Governor’s Proposal to End the Gas Tax: A Stupendously Bad Idea

Virginia Gas Tax, 1961-2012, real and nominal terms

Introduction

On January 8, 2013, in a major policy address on how to address Virginia’s urgent transportation funding needs, Governor Bob McDonnell proposed to end Virginia’s state tax on gas and replace it with a higher rate for the state sales tax.  Along with higher vehicle registration fees, a new special charge on fuel efficient vehicles, and a shift in general state funds away from other uses (primarily education, health, and public safety), the governor’s proposal would provide for an additional $3.2 billion over five years for transportation investments.

Virginia certainly desperately needs to fund higher investment in roads and highways.  Virginia has chronically underfunded such investments for years, leading to over-crowded and poorly maintained roads, especially in Northern Virginia.  But the governor surprised many on how to provide the needed funds.

The Governor’s Proposal

Instead of increasing the tax on fuels for cars and trucks (the traditional primary source of funds for roads and highways) to make up at least partially for what has been lost to inflation over the years, he instead called for getting rid of the gasoline tax altogether.  Instead of drivers paying through a fuel tax for the building and maintenance of the roads they use, he would shift the burden onto the state sales tax.  Everyone has to pay this, drivers and non-drivers alike.  Indeed, if the governor’s proposals were to be adopted, the one product people commonly buy that would not be subject either to the sales tax or an excise tax would be gasoline!

This is stupendously bad policy.  A basic principle of economics is that for efficiency, those who benefit from some good or service should pay what it costs to the extent this is possible.  Fuel taxes, when they are set at a rate to cover what one needs to invest in road construction and for maintenance, approximates this fairly well.  Those who drive more and hence burn more fuel, pay more.  Those who drive heavy vehicles, which disproportionately account for road deterioration, also pay more as their heavier vehicles burn more fuel.  The relationship is not perfect, but is much better than dropping any link whatsoever, as the governor proposes.  The fuel tax also acts as an incentive to buy vehicles with greater fuel efficiency (a national objective) and to drive less (and hence reduce pollution and congestion).

Virginia currently imposes a fuel tax of 17.5 cents per gallon for gasoline as well as diesel.  This rate has not changed since 1986 (taking effect in 1987).  The governor correctly points out that since it has not since been adjusted to reflect inflation, the 17.5 cents received today can buy only about 8 cents of what it could in 1986.  He also complains that since vehicles have become more fuel efficient, and since there are a small but growing number using alternative fuels such as ethanol, natural gas, and electricity, the state is receiving less through the fuel tax per mile driven than before.

These statements are true.  But there are obvious ways to address them instead of ending the gasoline tax altogether.  First, it is easy to index the fuel tax for inflation.  Every January 1 (or whatever anniversary date one wants to use) you adjust the rate to reflect inflation over the past year.  The adjustments each year would be small, but accumulate over time. With inflation currently running about 2% a year, a 17.5 cents per gallon fuel tax would rise to 17.85 cents, an increase of 0.35 cents – only about a third of a penny on gas that now costs $3 to $4 per gallon.

Second, one could charge similar taxes on vehicles powered by alternative fuels.  One could easily charge the same fuel tax rate for ethanol (just as one now charges the same 17.5 cents for both gasoline and diesel).  And one could work out the equivalent for natural gas and other fuels which are sold or will be sold at the equivalent of the pump for gasoline.

For electric power charging batteries it would be only slightly trickier.  Since one would normally charge the batteries at home from your household electricity supply, there is not the equivalent of a pump as the point where one could impose a tax to cover the costs of roads and highways.  But cars are inspected annually in Virginia.  At these annual inspections, one can check the mileage, see how many miles were driven in the past year, and then charge accordingly.  The amounts are not huge.  According to figures from the Federal Highway Administration, we on average drive 13,476 miles per year in the US, and the Energy Information Agency reports that the average fuel economy is 23.5 miles per gallon (as of 2010, the same as in 2009).  Dividing this out, the average driver burns 573 gallons per year, and with a tax at 17.5 cents per gallon, pays $100 in fuel taxes ($100.4 to be precise).  If the fuel tax were doubled to 35 cents, one would pay $200.  Such an amount (less if one has driven less, and more if one has driven more) could easily be charged at the time of the annual inspection.  And for plug-in hybrid vehicles, burning gas sometimes and using a battery charged at home other times, one could obtain a refund on your annual state income tax return for any fuel taxes paid at the pump (backed up by receipts).

None of this is impossible, and it need not be perfect.  And it is far better than charging drivers nothing at all for building and maintaining the roads they use.

Indexing the Fuel Tax for Inflation

The basic problem comes from not indexing the fuel taxes for inflation.  Virginia has imposed fuel taxes since 1923, and they have never, over this period, been as low as they are now in real terms.  In terms of today’s prices, they were at their highest in 1933 at what today would be 88 cents per gallon.  The nominal price then was 5 cents.  And it is absurd to argue that people today cannot afford 88 cents per gallon, when such a rate was possible in 1933 in the middle of the Great Depression.  People were far poorer then than they are now.

And no one is proposing a return to 88 cents per gallon for the state tax.  But it would not be unreasonable to return to the rate Virginia charged in 1961, or at least charged in 1987. The 1961 rate was 7 cents per gallon, and it generated sufficient revenues so that Virginia was widely seen at that time to have had one of the better road systems in the nation.  The 7 cents per gallon in 1961 would be a rate of about 54 cents today.  See the graph at the top of this post.  And again, if we could afford it in 1961 (and afford an even higher rate in real terms in 1933), it is absurd to say we cannot afford it today.

The graph also shows what the path would have been had Virginia, when it set the rate at 17.5 cents with effect from January 1, 1987, also then indexed the rate for inflation.  The rate would be a little over 35 cents per gallon today, or double the current rate.  This would also not be out of line with what other states charge.  North Carolina, on Virginia’s border, charges 37.8 cents per gallon, while New York charges 50.6 cents (the highest in the country).  The US average is 30.4 cents.  (To be precise and fair, to make these figures fully comparable one should also add a charge of 2.4 cents per gallon of fees for other purposes to what Virginia charges, in addition to the basic fuel tax.)

The governor’s detailed proposal provides estimates over the five years 2014 to 2018 of what the revenues would be under his proposals.  While losing the revenues generated by the fuel tax on gasoline, he would substitute by adding 0.8% points to the current 5.0% Virginia general sales tax, would keep the 17.5 cents tax on diesel fuel, and would take other measures (including shifts of funds out of education, health, and/or public safety; these areas account for 84% of Virginia’s non-transport budget so you would have to cut them; there is nothing else) to increase funds allocated to transportation.  Over the five years, funds for transport from the current fuel taxes on gasoline and diesel (if one were to keep them as now) would rise from $4.5 billion to a total of $7.7 billion, or an increase of $3.2 billion.

While the $7.7 billion total would be a good deal more than what is currently being funded for transport by the fuel taxes, many note that this would still be too low given the backlog of Virginia’s needs.  And in addition to being too low, it would shift the burden away from those who use the roads the most, onto the regressive sales tax which impacts the poor the most.

Alternatively, returning the fuel tax rate to what it was in 1987 in real terms, and even more so if it were returned to what it was in 1961 in real terms, would generate far more revenues.  Shifting to the 1987 rate and then indexing it for inflation, would generate revenues of $9.9 billion over the five years, an increase of $5.4 billion.  The governor is proposing an increase of only $3.2 billion.  Shifting to the 1961 rate and then indexing it for inflation, would generate revenues of $14.0 billion.  Such funding would permit a much more rapid rehabilitation of Virginia’s road infrastructure, and would be far fairer as those using the roads would pay for them in rough proportion to how much they use them.

Conclusion

In conclusion, there is no mystery as to why Virginia has been unable to invest in keeping up what was once a good road network:  It has allowed its source of funding for such investments to fall to the lowest it has been since first set in 1923.  But it would be straightforward to index the fuel tax to the rate of inflation, with a small annual adjustment which would not lead to this revenue source deteriorating over time.  Using fuel taxes to pay for roads is not only fair but is also efficient, as those who use the roads pay for them, and can decide whether and how much to drive based on facing the full cost of what they do.

In contrast, under Governor Bob McDonnell’s proposal:

  • The poor and the elderly and everyone else taking buses will pay more, while those driving Cadillacs will pay less;
  • The poor buying basic necessities will pay more, while the rich who like to drive out to a vacation or week-end home will pay less;
  • Those driving small and fuel efficient cars will pay more, while those driving gas guzzlers will pay less;
  • Those that decide to live close to where they work will pay more, while those who live in distant suburbs for a large house and lawn will pay less;
  • Those that car pool to work will pay more, while those driving alone each day will pay less;
  • Those that drive small and light cars which do not tear up the roads will pay more, while those that drive heavy vehicles which damage the roads disproportionately will pay less;
  • Virginians will pay more, while out-of-state drivers coming through the state and needing to buy gas will pay less;
  • Those driving alternative fuel vehicles will pay more, while those driving traditional gasoline fueled cars will pay less;
  • Those who purchase goods by catalog or over the internet and have them delivered by regular mail will pay more, while those who make frequent shopping trips by car will pay less;
  • And those that take care in not driving too much, adding to congestion and pollution, will pay more, while those who cannot be bothered will pay less.