The Fed is Not to Blame for the Falling Stock Market

Just a quick note on this Christmas Eve.  The US stock markets are falling.  The bull market that had started in March 2009, two months after Obama took office, and which then continued through to the end of Obama’s two terms, may be close to an end.  A bear market is commonly defined as one where the S&P500 index (a broad stock market index that most professionals use) has fallen by 20% or more from its previous peak.  As of the close of the markets this December 24, the S&P500 index is 19.8% below the peak it had reached on September 20.  The NASDAQ index is already in bear market territory, as it is 23.6% lower than its previous peak.  And the Dow Jones Industrial average is also close, at a fall of 18.8% from its previous peak.

Trump is blaming the Fed for this.  The Fed has indeed been raising interest rates, since 2015.  The Fed had kept interest rates at close to zero since the financial collapse in 2008 at the end of the Bush administration in order to spur a recovery.  And it had to keep interest rates low for an especially long time as fiscal policy turned from expansionary, in 2009/10, to contractionary, as the Republican Congress elected in 2010 forced through cuts in government spending even though employment had not yet then fully recovered.

Employment did eventually recover, so the Fed could start to bring interest rates back to more normal levels.  This began in late 2015 with an increase in the Fed’s target for the federal funds rate from the previous range of 0% to 0.25%, to a target range of 0.25% to 0.50%.  The federal funds rate is the rate at which banks borrow or lend federal funds (funds on deposit at the Fed) to each other, so that the banks can meet their deposit reserve requirements.  And the funds are borrowed and lent for literally just one night (even though the rates are quoted on an annualized basis).  The Fed manages this by buying and selling US Treasury bills on the open market (thus loosening or tightening liquidity), to keep the federal funds rate within the targeted range.

Since the 2015 increase, the Fed has steadily raised its target for the federal funds rate to the current range of 2.25% to 2.50%.  It raised the target range once in 2016, three times in 2017, and four times in 2018, always in increments of 0.25% points.  The market has never been surprised.  With unemployment having fallen to 5.0% in late 2015, and to just 3.7% now, this is exactly one would expect the Fed to do.

The path is shown in blue in the chart at the top of this post.  The path is for the top end of the target range for the rate, which is the figure most analysts focus on.  And the bottom end will always be 0.25% points below it.  The chart then shows in red the path for the S&P500 index.  For ease of comparison to the path for the federal funds rate, I have rescaled the S&P500 index to 1.0 for March 16, 2017 (the day the Fed raised the target federal funds rate to a ceiling of 1.0%), and then rescaled around that March 16, 2017, value to roughly follow the path of the federal funds rate.  (The underlying data were all drawn from FRED, the economic database maintained by the Federal Reserve Bank of St. Louis.  The data points are daily, for each day the markets were open, and the S&P 500 is as of the daily market close.)

Those paths were roughly similar up to September 2018, and only then did they diverge.  That is, the Fed has been raising interest rates for several years now, and the stock market was also steadily rising.  Increases in the federal funds rate by the Fed in those years did not cause the stock market to fall.  It is disingenuous to claim that it has now.

Why is the stock market now falling then?  While only fools claim to know with certainty what the stock market will do, or why it has moved as it has, Trump’s claim that it is all the Fed’s fault has no basis.  The Fed has been raising interest rates since 2015.  Rather, Trump should be looking at his own administration, capped over the last few days with the stunning incompetence of his Treasury Secretary, Steven Mnuchin.  With a perceived need to “do something” (probably at Trump’s instigation), Mnuchin made a big show of calling on Sunday the heads of the six largest US banks asking if they were fine (they were, at least until they got such calls, and might then have been left wondering whether the Treasury Secretary knew something that they didn’t), and then organizing a meeting of the “Plunge Protection Team” on Monday, Christmas Eve. This all created the sense of an administration in panic.

This comes on top of the reports over the weekend that Trump wants to fire the Chairman of the Fed, Jerome Powell.  Trump had appointed Powell just last year.  Nor would it be legal to fire him (and no president ever has), although some may dispute that.  Finally, and adding to the sense of chaos, a major part of the federal government is on shutdown starting from last Friday night, as Trump refused to approve a budget extension unless he could also get funding to build a border wall.  As of today, it does not appear this will end until some time after January 1.

But it is not just these recent events which may have affected the markets.  After all, the S&P500 index peaked on September 20.  Rather, one must look at the overall mismanagement of economic policy under Trump, perhaps most importantly with the massive tax cut to corporations and the wealthy of last December.  While a corporate tax cut will lead to higher after-tax corporate profits, all else being equal, all else will not be equal.  The cuts have also contributed to a large and growing fiscal deficit, to a size that is unprecedented (even as a share of GDP) during a time of full employment (other than during World War II).  A federal deficit which is already high when times are good will be massive when the next downturn comes.  This will then constrain our ability to address that downturn.

Plus there are other issues, such as the trade wars that Trump appears to take personal pride in, and the reversal of the regulatory reforms put in place after the 2008 economic and financial collapse in order not to repeat the mistakes that led to that crisis.

What will happen to the stock market now?  I really do not know.  Perhaps it will recover from these levels.  But with the mismanagement of economic policy seen in this administration, and a president who acts on whim and is unwilling to listen, it would not be a surprise to see a further fall.  Just don’t try to shift the blame to the Fed.

The Economy Under Trump in 8 Charts – Mostly as Under Obama, Except Now With a Sharp Rise in the Government Deficit

A.  Introduction

President Trump is repeatedly asserting that the economy under his presidency (in contrast to that of his predecessor) is booming, with economic growth and jobs numbers that are unprecedented, and all a sign of his superb management skills.  The economy is indeed doing well, from a short-term perspective.  Growth has been good and unemployment is low.  But this is just a continuation of the trends that had been underway for most of Obama’s two terms in office (subsequent to his initial stabilization of an economy, that was in freefall as he entered office).

However, and importantly, the recent growth and jobs numbers are only being achieved with a high and rising fiscal deficit.  Federal government spending is now growing (in contrast to sharp cuts between 2010 and 2014, after which it was kept largely flat until mid-2017), while taxes (especially for the rich and for corporations) have been cut.  This has led to standard Keynesian stimulus, helping to keep growth up, but at precisely the wrong time.  Such stimulus was needed between 2010 and 2014, when unemployment was still high and declining only slowly.  Imagine what could have been done then to re-build our infrastructure, employing workers (and equipment) that were instead idle.

But now, with the economy at full employment, such policy instead has to be met with the Fed raising interest rates.  And with rising government expenditures and falling tax revenues, the result has been a rise in the fiscal deficit to a level that is unprecedented for the US at a time when the country is not at war and the economy is at or close to full employment.  One sees the impact especially clearly in the amounts the US Treasury has to borrow on the market to cover the deficit.  It has soared in 2018.

This blog post will look at these developments, tracing developments from 2008 (the year before Obama took office) to what the most recent data allow.  With this context, one can see what has been special, or not, under Trump.

First a note on sources:  Figures on real GDP, on foreign trade, and on government expenditures, are from the National Income and Product Accounts (NIPA) produced by the Bureau of Economic Analysis (BEA) of the Department of Commerce.  Figures on employment and unemployment are from the Bureau of Labor Statistics (BLS) of the Department of Labor.  Figures on the federal budget deficit are from the Congressional Budget Office (CBO).  And figures on government borrowing are from the US Treasury.

B.  The Growth in GDP and in the Number Employed, and the Unemployment Rate

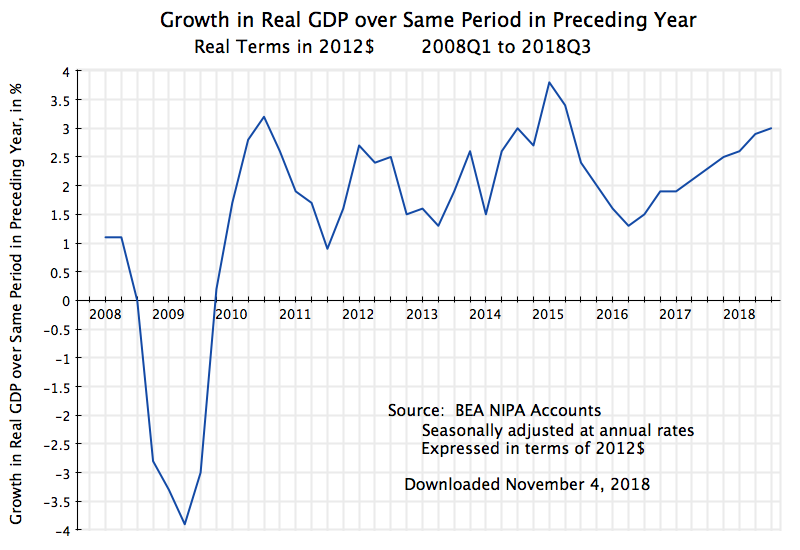
First, what has happened to overall output, and to jobs?  The chart at the top of this post shows the growth of real GDP, presented in terms of growth over the same period one year before (in order to even out the normal quarterly fluctuations).  GDP was collapsing when Obama took office in January 2009.  He was then able to turn this around quickly, with positive quarterly growth returning in mid-2009, and by mid-2010 GDP was growing at a pace of over 3% (in terms of growth over the year-earlier period).  It then fluctuated within a range from about 1% to almost 4% for the remainder of his term in office.  It would have been higher had the Republican Congress not forced cuts in fiscal expenditures despite the continued unemployment.  But growth still averaged 2.2% per annum in real terms from mid-2009 to end-2016, despite those cuts.

GDP growth under Trump hit 3.0% (over the same period one year before) in the third quarter of 2018.  This is good.  And it is the best such growth since … 2015.  That is not really so special.

Net job growth has followed the same basic path as GDP:


Jobs were collapsing when Obama took office, he was quickly able to stabilize this with the stimulus package and other measures (especially by the Fed), and job growth resumed.  By late 2011, net job growth (in terms of rolling 12-month totals (which is the same as the increase over what jobs were one year before) was over 2 million per year.  It went to as high as 3 million by early 2015.  Under Trump, it hit 2 1/2 million by September 2018.  This is pretty good, especially with the economy now at or close to full employment.  And it is the best since … January 2017, the month Obama left office.

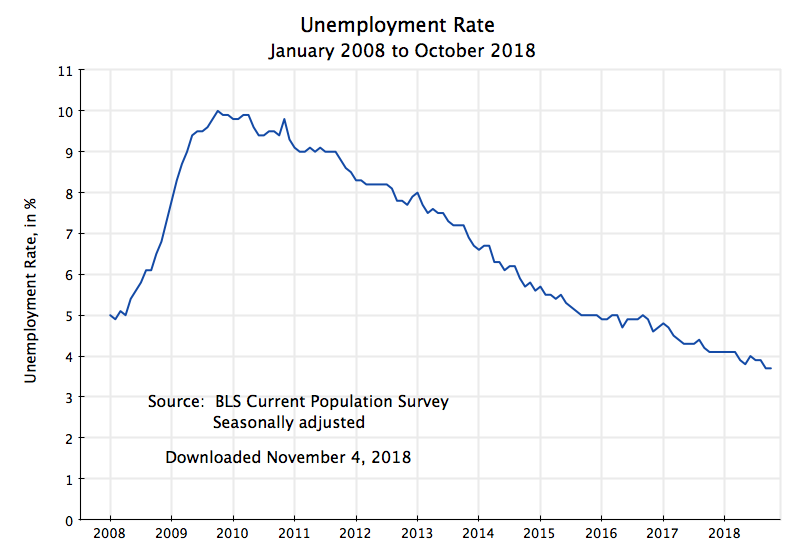
Finally, the unemployment rate:

Unemployment was rising rapidly as Obama was inaugurated, and hit 10% in late 2009.  It then fell, and at a remarkably steady pace.  It could have fallen faster had government spending not been cut back, but nonetheless it was falling.  And this has continued under Trump.  While commendable, it is not a miracle.

C.  Foreign Trade

Trump has also launched a trade war.  Starting in late 2017, high tariffs were imposed on imports of certain foreign-produced products, with such tariffs then raised and extended to other products when foreign countries responded (as one would expect) with tariffs of their own on selected US products.  Trump claims his new tariffs will reduce the US trade deficit.  As discussed in an earlier blog post, such a belief reflects a fundamental misunderstanding of how the trade balance is determined.

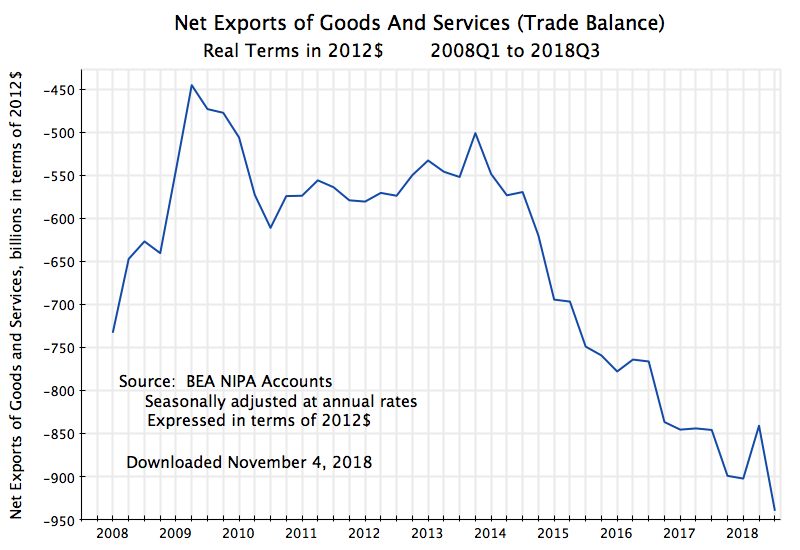
But what do we see in the data?:

The trade deficit has not been reduced – it has grown in 2018.  While it might appear there had been some recovery (reduction in the deficit) in the second quarter of the year, this was due to special factors.  Exports primarily of soybeans and corn to China (but also other products, and to other countries where new tariffs were anticipated) were rushed out in that quarter in order arrive before retaliatory tariffs were imposed (which they were – in July 2018 in the case of China).  But this was simply a bringing forward of products that, under normal conditions, would have been exported later.  And as one sees, the trade balance returned to its previous path in the third quarter.

The growing trade imbalance is a concern.  For 2018, it is on course for reaching 5% of GDP (when measured in constant prices of 2012).  But as was discussed in the earlier blog post on the determination of the trade balance, it is not tariffs which determine what that overall balance will be for the economy.  Rather, it is basic macro factors (the balance between domestic savings and domestic investment) that determine what the overall trade balance will be.  Tariffs may affect the pattern of trade (shifting imports and exports from one country to another), but they won’t reduce the overall deficit unless the domestic savings/investment balance is changed.  And tariffs have little effect on that balance.

And while the trend of a growing trade imbalance since Trump took office is a continuation of the trend seen in the years before, when Obama was president, there is a key difference.  Under Obama, the trade deficit did increase (become more negative), especially from its lowest point in the middle of 2009.  But this increase in the deficit was not driven by higher government spending – government spending on goods and services (both as a share of GDP and in constant dollar terms) actually fell.  That is, government savings rose (dissavings was reduced, as there was a deficit).  Private domestic savings was also largely unchanged (as a share of GDP).  Rather, what drove the higher trade deficit during Obama’s term was the recovery in private investment from the low point it had reached in the 2008/09 recession.

The situation under Trump is different.  Government spending is now growing, as is the government deficit, and this is driving the trade deficit higher.  We will discuss this next.

D.  Government Accounts

An increase in government spending is needed in an economic downturn to sustain demand so that unemployment will be reduced (or at least not rise by as much otherwise).  Thus government spending was allowed to rise in 2008, in the last year of the Bush administration, in response to the downturn that began in December 2007.  This continued, and was indeed accelerated, as part of the stimulus program passed by Congress soon after Obama took office.  But federal government spending on goods and services peaked in mid-2010, and after that fell.  The Republican Congress forced further expenditure cuts, and by late 2013 the federal government was spending less (in real terms) than it was in early 2008:

This was foolish.  Unemployment was over 9 1/2% in mid-2010, and still over 6 1/2% in late-2013 (see the chart of the unemployment rate above).  And while the unemployment rate did fall over this period, there was justified criticism that the pace of recovery was slow.  The cuts in government spending during this period acted as a major drag on the economy, holding back the pace of recovery.  Never before had a US administration done this in the period after a downturn (at least not in the last half-century where I have examined the data).  Government spending grew especially rapidly under Reagan following the 1981/82 downturn.

Federal government spending on goods and services was then essentially flat in real terms from late 2013 to the end of Obama’s term in office.  And this more or less continued through FY2017 (the last budget of Obama), i.e. through the third quarter of CY2018.  But then, in the fourth quarter of CY2017 (the first quarter of FY2018, as the fiscal year runs from October to September), in the first full budget under Trump, federal government spending started to rise sharply.  See the chart above.  And this has continued.

There are certainly high priority government spending needs.  But the sequencing has been terribly mismanaged.  Higher government spending (e.g. to repair our public infrastructure) could have been carried out when unemployment was still high.  Utilizing idle resources, one would not only have put people to work, but also would have done this at little cost to the overall economy.  The workers were unemployed otherwise.

But higher government spending now, when unemployment is low, means that workers hired for government-funded projects have to be drawn from other activities.  While the unemployment rate can be squeezed downward some, and has been, there is a limit to how far this can go.  And since we are close to that limit, the Fed is raising interest rates in order to curtail other spending.

One sees this in the numbers.  Overall private fixed investment fell at an annual rate of 0.3% in the third quarter of 2018 (based on the initial estimates released by the BEA in late October), led by a 7.9% fall in business investment in structures (offices, etc.) and by a 4.0% fall in residential investment (homes).  While these are figures only for one quarter (there was a deceleration in the second quarter, but not an absolute fall), and can be expected to eventually change (with the economy growing, investment will at some point need to rise to catch up), the direction so far is worrisome.

And note also that this fall in the pace of investment has happened despite the huge cuts in corporate taxes from the start of this year.  Trump officials and Republicans in Congress asserted that the cuts in taxes on corporate profits would lead to a surge in investment.  Many economists (including myself, in the post cited above) noted that there was little reason to believe such tax cuts would sput corporate investment.  Such investment in the US is not now constrained by a lack of available cash to the corporations, so giving them more cash is not going to make much of a difference.  Rather, that windfall would instead lead corporations to increase dividends as well as share buybacks in order to distribute the excess cash to their shareholders.  And that is indeed what has happened, with share buybacks hitting record levels this year.

Returning to government spending, for the overall impact on the economy one should also examine such spending at the state and local level, in addition to the federal.  The picture is largely similar:

This mostly follows the same pattern as seen above for federal government spending on goods and services, with the exception that there was an increase in total government spending from early 2014 to early-2016, when federal spending was largely flat.  This may explain, in part, the relatively better growth in GDP seen over that period (see the chart at the top of this post), and then the slower pace in 2016 as all spending leveled off.

But then, starting in late-2017, total government expenditures on goods and services started to rise.  It was, however, largely driven by the federal government component.  Even though federal government spending accounted only for a bit over one-third (38%) of total government spending on goods and services in the quarter when Trump took office, almost two-thirds (65%) of the increase in government spending since then was due to higher spending by the federal government.  All this is classical Keynesian stimulus, but at a time when the economy is close to full employment.

So far we have focused on government spending on goods and services, as that is the component of government spending which enters directly as a component of GDP spending.  It is also the component of the government accounts which will in general have the largest multiplier effect on GDP.  But to arrive at the overall fiscal deficit, one must also take into account government spending on transfers (such as for Social Security), as well as tax revenues.  For these, and for the overall deficit, it is best to move to fiscal year numbers, where the Congressional Budget Office (CBO) provides the most easily accessible and up-to-date figures.

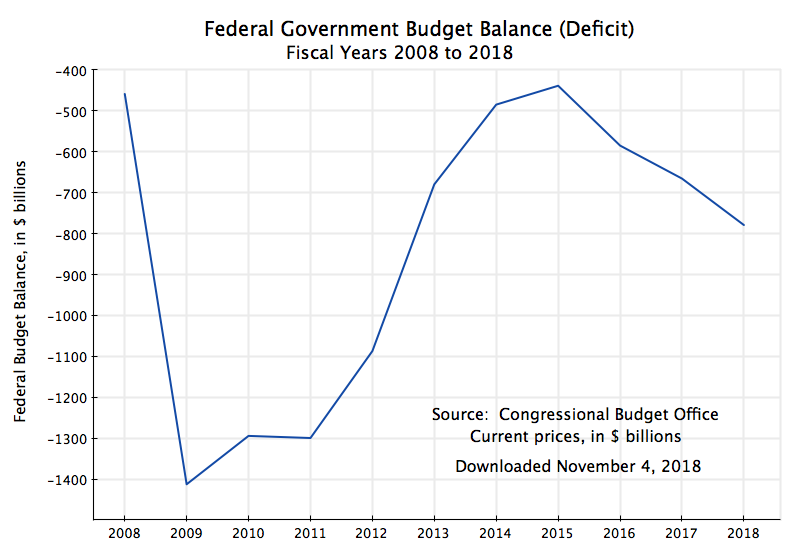
Tracing the overall federal fiscal deficit, now by fiscal year and in nominal dollar terms, one finds:

The deficit is now growing (the fiscal balance is becoming more negative) and indeed has been since FY2016.  What happened in FY2016?  Primarily there was a sharp reduction in the pace of tax revenues being collected.  And this has continued through FY2018, spurred further by the major tax cut bill of December 2017.  Taxes had been rising, along with the economic recovery, increasing by an average of $217 billion per year between FY2010 and FY2015 (calculated from CBO figures), but this then decelerated to a pace of just $26 billion per year between FY2015 and FY2018, and just $13 billion in FY2018.  The rate of growth in taxes between FY2015 and FY2018 was just 0.8%, or less even than just inflation.

Federal government spending, including on transfers, also rose over this period, but by less than taxes fell.  Overall federal government spending rose by an average of just $46 billion per year between FY2010 and FY2015 (a rate of growth of 1.3% per annum, or less than inflation in those years), and then by $140 billion per year (in nominal dollar terms) between FY2015 and FY2018.  But this step up in overall spending (of $94 billion per year) was well less than the step down in the pace of tax collection (a reduction of $191 billion per year, the difference between $217 billion annual growth over FY2010-15 and the $26 billion annual growth over FY2015-18).

That is, about two-thirds (67%) of the increase in the fiscal deficit since FY2015 can be attributed to taxes being cut, and just one-third (33%) to spending going up.

Looking forward, this is expected to get far worse.  As was discussed in an earlier post on this blog, the CBO is forecasting (in their most recent forecast, from April 2018) that the fiscal deficits under Trump will reach close to $1 trillion in FY2019, and will exceed 5% of GDP for most of the 2020s.  This is unprecedented for the US economy at full employment, other than during World War II.  Furthermore, these CBO forecasts are under the optimistic scenario that there will be no economic downturn over this period.  But that has never happened before in the US.

Deficits need to be funded by borrowing.  And one sees an especially sharp jump in the net amount being borrowed in the markets in CY 2018:


These figures are for calendar years, and the number for 2018 includes what the US Treasury announced on October 29 it expects to borrow in the fourth quarter.  Note this borrowing is what the Treasury does in the regular, commercial, markets, and is a net figure (i.e. new borrowing less repayment of debt coming due).  It comes after whatever the net impact of public trust fund operations (such as for the Social Security Trust Fund) is on Treasury funding needs.

The turnaround in 2018 is stark.  The US Treasury now expects to borrow in the financial markets, net, a total of $1,338 billion in 2018, up from $546 billion in 2017.  And this is at time of low unemployment, in sharp contrast to 2008 to 2010, when the economy had fallen into the worst economic downturn since the Great Depression  Tax revenues were then low (incomes were low) while spending needed to be kept up.  The last time unemployment was low and similar to what it is now, in the late-1990s during the Clinton administration, the fiscal accounts were in surplus.  They are far from that now. 

E. Conclusion 

The economy has continued to grow since Trump took office, with GDP and employment rising and unemployment falling.  This has been at rates much the same as we saw under Obama.  There is, however, one big difference.  Fiscal deficits are now rising rapidly.  Such deficits are unprecedented for the US at a time when unemployment is low.  And the deficits have led to a sharp jump in Treasury borrowing needs.

These deficits are forecast to get worse in the coming years even if the economy should remain at full employment.  Yet there will eventually be a downturn.  There always has been.  And when that happens, deficits will jump even further, as taxes will fall in a downturn while spending needs will rise.

Other countries have tried such populist economic policies as Trump is now following, when despite high fiscal deficits at a time of full employment, taxes are cut while government spending is raised.  They have always, in the end, led to disasters.

Taxes on Corporate Profits Have Collapsed

A.  Introduction:  The Plunge in Corporate Profit Tax Revenues

Corporate profit tax revenues have collapsed following the passage by Congress last December of the Trump-endorsed Republican tax plan.  And this is not because corporate profits have decreased:  They have kept going up.  The initial figures, for the first half of 2018, show federal corporate profit taxes (also referred to as corporate income taxes) collected have fallen to an annual rate of roughly just $150 billion.  This is only half, or less, of the $300 to $350 billion collected (at annual rates) over the past several years.  See the chart above.

The estimates on corporate profit taxes actually being paid through the first half of 2018 come from the National Income and Product Accounts (NIPA, and commonly also referred to as the GDP accounts) produced by the Bureau of Economic Analysis.  The figures are collected as part of the process of producing the GDP accounts, but for various reasons the figures on corporate profit taxes are not released with the initial GDP estimates (which come out at the end of the month that follows the end of each quarter), but rather one month later (i.e. on August 29 this time, for the estimates for the April to June quarter).  The quarterly estimates are seasonally adjusted (which is important, as tax payments have a strong seasonality to them), and are then shown at annual rates.  While we already saw such a collapse in corporate tax revenues in the figures for the first quarter of 2018 (first published in May), it is always best with the estimates of GDP and its components to wait until a second quarter’s figures are available to see whether any change is confirmed.  And it was.

This initial data on what is actually now being collected in taxes following the passage of the Republican tax plan last December suggests that the revenue losses will be substantially higher than the $1.5 trillion over ten years that the staff at the Joint Committee on Taxation (the official arbiters for Congress on such matters) forecast.  Indeed, the plunge in corporate profit tax collections alone looks likely to well exceed this.  On top of this, there were also sharp cuts in non-corporate business taxes and in income taxes for those in higher income groups.

This blog post will look at what the initial figures are revealing on the tax revenues being collected, as estimated in the GDP accounts.  The focus will be on corporate income taxes, although in looking at the total tax revenue losses we will also look briefly at what the initial data is indicating on reductions in individual income taxes being paid.

The chart above shows what the reduction has been in corporate profit taxes in dollar terms.  In the next section below we will look at this in terms of the taxes as a share of corporate profits.  That implicit average actual tax rate is more meaningful for comparisons over time, and it has also plunged.  And the implicit actual rate now being paid, of only about 7% for the taxes at the federal government level, shows how misleading it is to focus on the headline rate of tax on corporate profits of 21% (down from 35% before the new law).  The actual rate being paid is only one-third of this, as a consequence of the numerous loopholes built into the law.  The Republican proponents of the bill had argued that while they were cutting the headline rate from 35% to 21%, they were also (they asserted) ending many of the loopholes which allowed corporations to pay less.  But in fact numerous loopholes were added or expanded.

The next section of the post will then look at this in the longer term context, with figures on the implicit corporate profit tax rate going back to 1950.  The implicit rate has fallen steadily over time, from a rate that reached over 50% in the early 1950s, to just 7% now.  While Trump and his Republican colleagues argued the cut in corporate taxes was necessary in order for the economy to grow, the economy in fact grew at a faster pace in the 1950s and 1960s, when the rate paid varied between 30 and 50%, than it has in recent decades despite the now far lower rates corporations face.

But this is for the federal tax on corporate profits alone.  There are also taxes on corporate profits imposed at the state and local level, as well as by foreign governments (although such foreign taxes are then generally deductible from the taxes due domestically).  This overall tax burden is more meaningful for understanding whether the overall burden is too high.  But, as we shall see below, that rate has also fallen steadily over time.  There is again no evidence that lower rates lead to higher growth.

The final substantive section of the post will then look more closely at the magnitude of the revenue losses from the December bill.  They are massive, and based on the initial evidence could very well total over $2 trillion over ten years for the losses on the corporate profit tax alone.  The losses from the other tax cuts in the new law, primarily for the wealthy and for non-corporate business, will add to this.  A very rough estimate is that the losses in individual income tax revenues may total an additional $1 trillion, bringing the total to over $3 trillion.  This is double the $1.5 trillion loss in revenues originally forecast.

But first, an analysis of what we see from the initial evidence on what is being paid.

B.  Profit Taxes as a Share of Corporate Profits

The chart at the top of this post shows what has been collected, by quarter (but shown at an annual rate), by the federal tax on corporate profits over the last several years.  Those figures are in dollars, and show a fall in the first half of 2018 of a half or more compared to what was collected in recent years.  But for comparisons over time, it is more meaningful to look at the implicit corporate tax rate, as corporate profits change over time (and generally grow over time).  And this can be done as the National Income and Product Accounts include an estimate of what corporate profits have been, as part of its assessment of how national income is distributed among the major functional groups.

That share since 2013 has been:

Between 2013 and 2016, the implicit rate (quarter by quarter) varied between about 15 and 17%.  It came down to about 14% for most of 2017 for some reason (possibly tied to the change in administration in Washington, with its new interpretation of regulatory and tax rules), but one cannot know from the aggregate figures alone.  But the rate then fell sharply, by half, to just 7% after the new tax law entered into effect.

A point to note is that the corporate profit figures provided here are corporate profits as estimated in the National Income and Product Accounts.  They are a measure of what corporate profits actually are, in an economic sense, and will in general differ from what corporate profits are as defined for tax purposes.  Thus, for example, accelerated depreciation allowed for tax purposes will reduce taxable corporate profits.  But the BEA estimates for the NIPA accounts will reflect not the accelerated depreciation allowed for tax purposes, but rather an estimate of what depreciation actually was.  Thus the figures as shown in the chart above will be a measure of what the true average corporate tax rate actually was, before the adjustments made (as permitted under tax law) to arrive at taxable corporate profits.

That average rate is now just 7%.  That is only one-third of the headline rate under the new law of 21%.  Provisions in the tax code allow corporations to pay far less in tax than what the headline rate would suggest.  This is not new (the headline rate previously was 35%, but the actual average rate paid was just 15 to 17% between 2013 and 2016, and 14% in most of 2017).  But Trump administration officials had asserted that many of the loopholes allowing for lower taxes would be ended under the new tax law, so that the actual rate paid would be closer to the headline rate.  But this clearly did not happen.  As many independent analysts pointed out before the bill was passed, the new tax law had numerous provisions which would allow the system to be gamed.  And we now see the result of that in the figures.

C.  Corporate Taxes in a Longer Term Context

The cuts in corporate profit taxes are not new.  Taxes on corporate profits in the US used to be far higher:
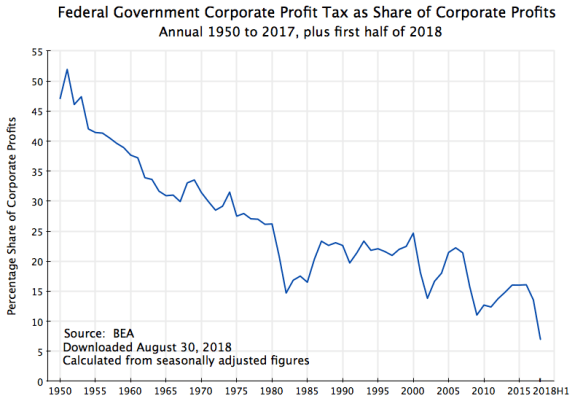
In the early 1950s, the federal tax on corporate profits (actually paid, not the headline rate) reached over 50%.  While it then fell, it kept to a rate of between about 30% and 50% through the 1950s and 60s.  And this was a period of good economic growth in the US – substantially faster than it has been since.  A high tax rate on corporate profits did not block growth.  Indeed, if one looked just at the simple correlation, one might conclude that a higher tax on corporate profits acts as a spur to growth.  But this would be too simplistic, and I would not argue that.  But what one can safely conclude is that a high rate of tax on corporate profits does not act as a block to more rapid growth.

There have also been important distributional consequences, however.  Corporate wealth is primarily owned by the wealthy (duh), and the sharp decline in taxes paid on corporate profits means that a larger share of the overall tax burden has been shifted to taxes on individual incomes, which are primarily borne by the middle classes.  Based on figures in the NIPA accounts, in 1950 taxes on individual incomes (including Social Security taxes) accounted for 47% of total federal taxes, while taxes on corporate profits accounted for 35% (with the rest primarily various excise taxes such as on fuels, liquor, tobacco, etc., plus import duties).  By 2017, however, the share of taxes on individual incomes had grown to 87.4%, while the share on corporate profits had declined to just 8.6%.  There was a gigantic shift away from taxes on wealth to taxes on individual incomes – taxes that are borne primarily by the middle class.  And that share will now fall further in 2018, by about half.

The chart above is for federal corporate profit taxes alone.  It could be argued that what matters to growth is not just the corporate profit taxes paid at the federal level, but all such taxes, including those paid at the state and local level, as well as to foreign governments (although the taxes paid abroad are generally deductible on their domestic taxes, so that will be a wash).

That chart looks like:

This follows the same path as the chart for federal corporate profit taxes alone, with a similar decline.  With the federal share of such taxes averaging 84% over the period (up to 2017), this is not surprising.  The federal share will now fall sharply in 2018, due to the new tax law.  But over the 1950 to 2017 period, the chart covering all taxes on corporate profits is basically a close to proportionate increase over what the tax has been at the federal level alone.

So the same pattern holds, and the total of the taxes on corporate profits varied between 33% to over 50% in the 1950s and 60s, to between 15 and 20% in recent years before the plunge in the first half of 2018 to just 10%.  But the relatively high taxes in the 1950s and 60s did not lead to slow growth in those years, nor did the low taxes in recent decades lead to more rapid growth.  Rather, one had the reverse.

D.  An Estimate of the Revenue Losses Due to the Tax Bill

These initial figures on the taxes actually being paid following the passage of the Republican tax bill allow us to make an estimate of what the revenue losses will turn out to be.  These will be very rough estimates, as we only have data for half a year, and one should be cautious in extrapolating this to what the losses will be over a decade.  But they can give us a sense of the magnitude.  And it is large.  As we will see below, based on the evidence so far the revenue losses (from the cuts in both corporate taxes and in personal income taxes) might be over $3 trillion over ten years, or about double the $1.5 trillion loss estimate originally forecast.

First, for the federal taxes on corporate profits, as the largest changes are there:  As was discussed before (and seen in the charts above), corporate profit taxes paid as a share of corporate profits were relatively flat between 2013 and 2016, varying between 15 and 17% each quarter, before falling to 14% for most of 2017.  For the full 2013 to 2017 period, the simple average was 15.3%.  The implicit rate then fell to just 7.0% in the first half of 2018.  Had the rate instead remained at 15.3%, corporate profit taxes collected in 2018 would have been $184 billion higher (on an annual basis).

This is not small, and is twice as high as the estimate of the staff of the Joint Committee on Taxation of revenue losses of $91 billion in FY2019 (the first full year under the new tax regime) from all the tax measures affecting businesses (including non-corporate businesses, and covering both domestic business and overseas business).  It is three times as high as the estimated loss of $60 billion in FY18, but the new tax law did not affect the first quarter of FY2018 (October to December).

One should be cautious with any extrapolation of this loss estimate going forward, as not only is the time period of actual experience under the new tax regime short (only a half year), but the law is also a complicated one, with certain provisions changing over time.  But a simple extrapolation over ten years, based on the assumption that corporate profits grow at just a modest 3% a year in nominal terms (meaning 1% a year in real terms if inflation is 2% a year), and that the tax rate on corporate profits will be 7.0% a year (as seen so far in 2018) rather than the 15.3% of recent years, implies that the reduction in corporate profit tax revenues will sum to about $2.1 trillion.

Note that the losses would be greater (everything else equal) if the assumed growth rate of corporate profits is higher.  But the results are not very sensitive to this.  The total losses over ten years would be $2.2 trillion, for example, at an assumed nominal growth rate of 4% (i.e. with inflation still at 2%, then with corporate profits growing at 2% a year in real terms, or double the 1% rate of the base scenario).  Note this also counters the argument of some that such tax cuts will lead to such a large spurt in growth that total tax collections will rise despite the cut in the rates.  As will be discussed below, there is no evidence that this has ever been the case in the US.  But even assuming there were, the argument is undermined by the basic arithmetic.  In the example here, a doubling of the assumed growth rate of profits (from 1% in real terms to 2%) would imply taxes on corporate profits would still fall by $2.0 trillion over the next ten years.  This is not far from the $2.1 trillion loss if there is no rise at all in the growth of corporate profits.  And a doubling of the real growth rate is far above what anyone would reasonably assume could follow from such a cut in the tax rate.

Second, there were also substantial cuts in individual income taxes, although primarily for the wealthy.  While far less in proportional terms, the substantially higher taxes that are now paid by individuals than by corporations means that this is also significant for the totals.

Specifically, individual (federal) income taxes as a share of GDP in the NIPA accounts were quite steady in the quarterly GDP accounts for the period from 2015Q1 to 2017Q4, varying only between 8.22% and 8.44%.  The average was 8.31%.  But then this fell to an average of 7.89% in the first half of 2018 (7.90% in the first quarter, and 7.87% in the second quarter).  Had the rate remained at 8.31%, then $86 billion more in revenues (at an annual rate) would have been collected.

Extrapolating this out for ten years, assuming again just a modest rate of growth for GDP of 3% a year in nominal terms (i.e. just 1% a year in real terms if inflation is 2% a year), the total loss would be $1.0 trillion.  With a higher rate of growth, and everything else the same, the losses would again be larger.  This extrapolation is, however, particularly fraught, as the Republicans wrote into their bill that the cuts in individual taxes would be reversed in 2026.  They did this to keep the forecast cost of the tax bill to the $1.5 trillion envelope they had set, and an effort is already underway to make this permanent (Speaker Paul Ryan has said he will schedule a vote on this in September).  But even if we left out the tax revenue losses in the final two years of the period, the losses in individual taxes would still reach about $0.8 trillion.

Adding the lower revenues from the taxes on corporate profits and the taxes on individual incomes, the total revenue losses would come, over the ten years, to about $3 trillion.  This is double the $1.5 trillion loss that had been forecast.  It is not a small difference.

To give a sense of the magnitude, the loss in 2018 alone (a total of $270 billion) would allow a doubling of the entire budgets (based on FY2017 actual outlays) of the Departments of Education, Housing and Urban Development, and Labor; the Environmental Protection Agency; all international assistance programs (foreign aid); NASA; the National Science Foundation; the Army Corps of Engineers (civil works); and the Small Business Administration.  Note I am not arguing that all of their budgets should necessarily be doubled (although many should, indeed, be significantly increased).  Rather, the point is simply to give readers a sense of the size of the revenues lost as a consequence of the tax cut bill.

As another comparison to give a sense of the magnitude, just half of the lost revenue (now and into the future) would suffice to fund fully the Social Security Trust Fund for the foreseeable future.  If nothing is done, the Social Security Trust Fund will run out at some point around 2034.  Republicans have asserted that nothing can be done for Social Security except to scale back (already low) Social Security pensions.  This is not true.  Just half of the revenues that will be lost under the tax cut bill would suffice to ensure the pensions can be paid in full for at least 75 years (the forecast period used by the Social Security trustees).

But as noted above, proponents of the tax cuts argue that the lower taxes will spur growth.  This has been discussed in earlier posts on this blog, where we have seen that there is no evidence that this will follow.  There are not only basic conceptual problems with this argument (a misreading of basic economics), but also no indication in what we have in fact observed for the economy that this has ever been the case (whether in the years immediately following the major tax cuts of Reagan or Bush, nor if one focuses on the longer term).

Administration officials have not surprisingly argued that the relatively rapid pace of growth in the second quarter of 2018 (of 4.2% at an annual rate in the end-August BEA estimates) is evidence of the tax cut working as intended.  But it is not.  Not only should one not place much weight on one quarter’s figures (the quarterly figures bounce around), but this followed first-quarter figures which were modest at best (with GDP growth of an estimated 2.2% at an annual rate).

But more fundamentally, one should dig into the GDP figures to see what is going on.  The argument that tax cuts (especially cuts in corporate profit taxes) will spur growth is based on the presumption that such cuts will spur business investment.  More such investment, especially in equipment, could lead to higher productivity and hence higher growth.  But growth in business investment in equipment has slowed in the first half of 2018.  Such investment grew at the rates of 9.1%, 9.7%, 9.8%, and 9.9% through the four quarters of 2017 (all at annual rates).  It then decelerated to a pace of 8.5% in the first quarter of 2018 and to a pace of 4.4% in the second quarter.  While still early (these figures too bounce around a good deal), the evidence so far is the exact opposite of what proponents have argued the tax cut bill would do.

So what might be going on?  As noted before, there is first of all a good deal of volatility in the quarterly figures for GDP growth.  But to the extent growth has accelerated this year, a more likely explanation is simple Keynesian stimulus.  Taxes were cut, and while most of the cuts went to the rich, some did go to the lower and middle classes.  In addition, government spending is now rising, while it been kept flat or falling for most of the Obama years (since 2010).  It is not surprising that such stimulus would spur growth in the short run.

The problem is that with the economy now running at or close to full capacity, such stimulus will not last for long.  And when it was needed, in the years from 2010 until 2016, as the economy recovered from the 2008/09 downturn (but slowly), such stimulus measures were repeatedly blocked by a Republican-controlled Congress.  This sequence for fiscal policy is the exact opposite of the path that should have been followed.  Contractionary policies were followed after 2010 when unemployment was still high, while expansionary fiscal policies are being followed now, when unemployment is low.  The result is that the fiscal deficit is rising soon to exceed $1 trillion in a year (5% of GDP), which is unprecedented for a period with the economy at full employment.

E.  Conclusion

We now have initial figures on what is being collected in taxes following the tax cut bill of last December.  While still early, the figures for the first two quarters of 2018 are nonetheless clear for corporate profit taxes:  They have fallen by half.  Corporate profit taxes paid would be an estimated $184 billion higher in 2018 had the tax rate remained at the level it had been over the last several years.

While this post has not focused on personal income taxes, they too were cut.  The reduction here was more modest – only by about 5% overall (although certain groups got far more, while others less).  But with their greater importance in overall federal tax collections, this 5% reduction is leading to an estimated $86 billion reduction in revenues (in 2018) from this source.

Based on what has been observed in the first two quarters of 2018, the two taxes together (corporate and individual) will see a combined reduction in taxes paid of about $270 billion in 2018.  Extrapolating over ten years, the combined losses may be on the order of $3 trillion.

These losses are huge.  And they are double what had been earlier forecast for the tax bill.  Just half of what is being lost would suffice to ensure Social Security would be fully funded for the foreseeable future.  And the rest could fund programs to rebuild and strengthen the physical infrastructure and human capital on which growth ultimately depends.  Or some could be used to reduce the deficit and pay down the public debt.  But instead, massive tax cuts are going to the rich.